How to pivot your data
Notice: Undefined offset: 1 in /data/httpd/www/html/wp-includes/media.php on line 70
This tutorial demonstrates how to use Data preparation to change rows into columns in your dataset.
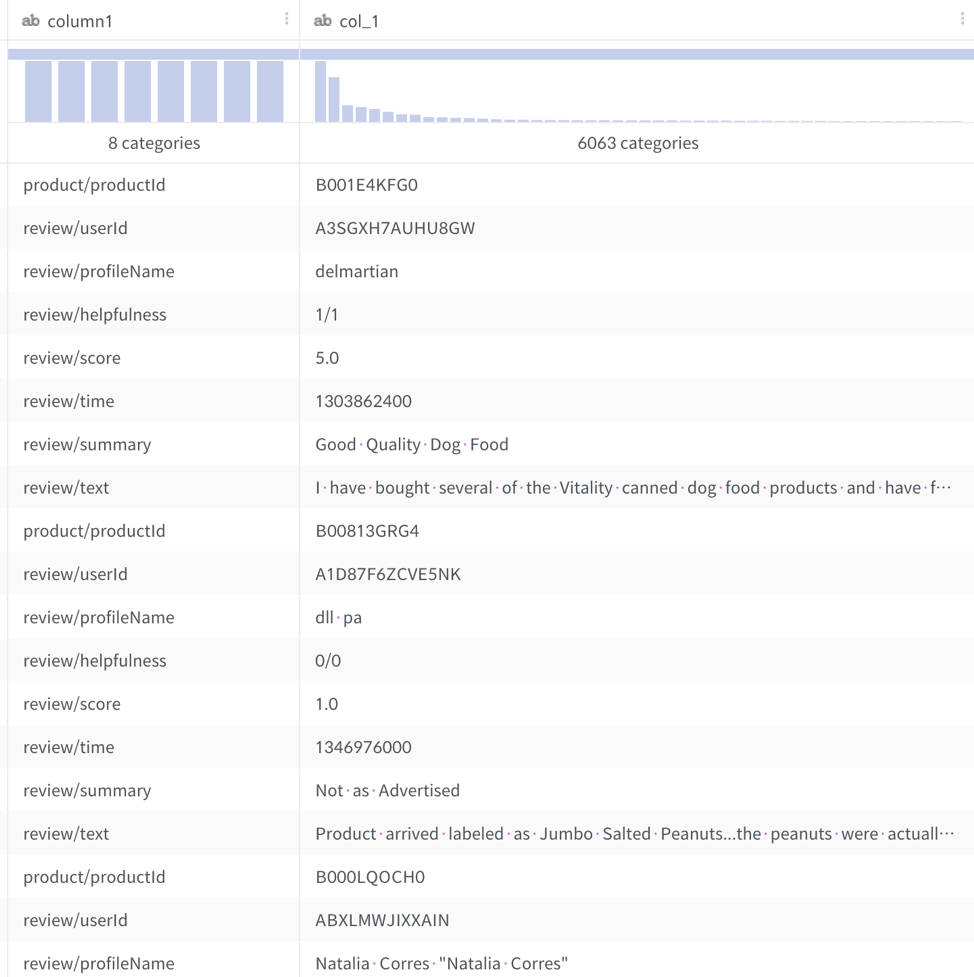
Let’s look at the following sample data:
The above data consists of field name and values. Filed names are consisted of productId, userId, profileName, helpfulness, score, time, summary, and text. How do you represent these fields in a single row? Using the lead function, one of the window preparation functions in the data preparation, the following expression is possible.
The following is the Data preparation script used for the above transformation.
window value: lead(col_1,7),lead(col_1,6),lead(col_1,5),lead(col_1,4),lead(col_1,3),lead(col_1,2),lead(col_1,1)
keep row: `column1` == 'product/productId'
drop col: `column1`, `col_1`
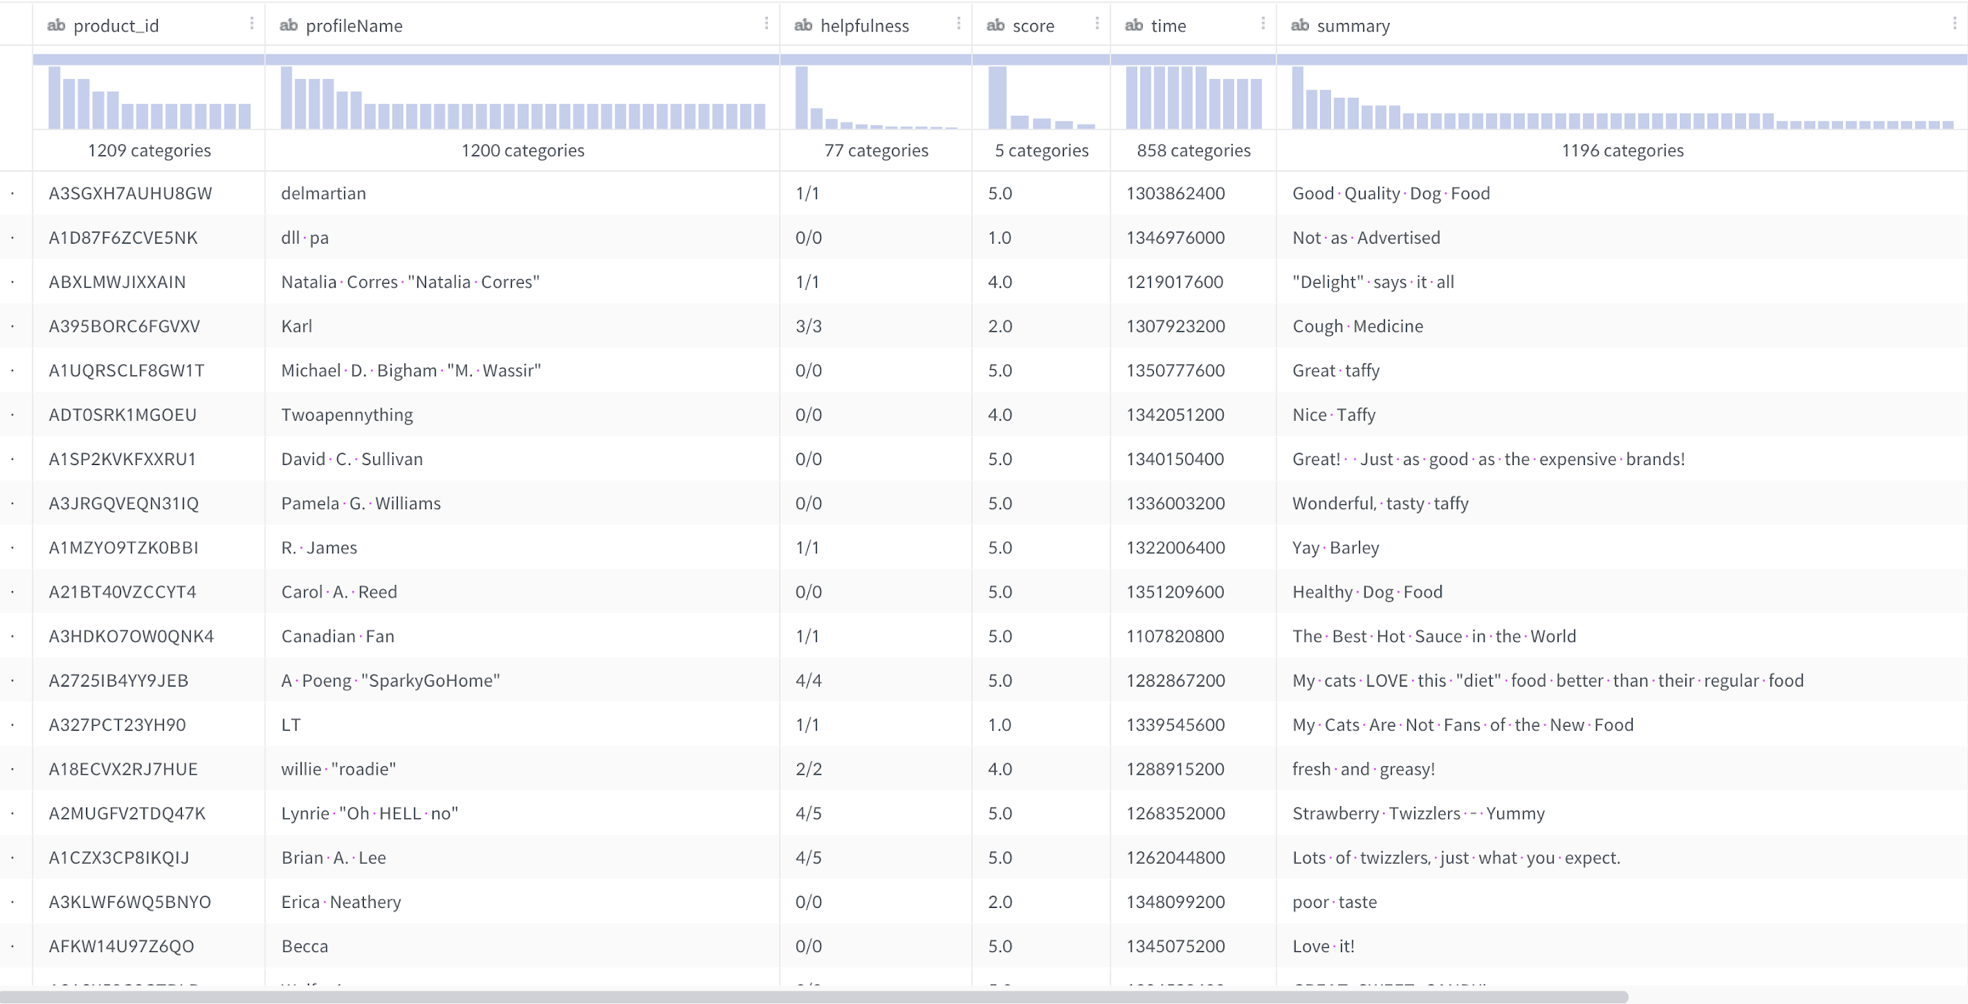
The important function here is the lead function, which is a window function. The meaning of lead (col_1, 7) is to create a new column using the value of col_1, which is seven rows below the current row. With this, it is possible to change the data composed of 8 rows into one column of 8 columns.
Data Preparation makes data preprocessing work much easier like this. Course you can try it with our demo web service.