Create a dashboard with Presto DB and Druid
Notice: Undefined offset: 1 in /data/httpd/www/html/wp-includes/media.php on line 70
Hello, users!
This time we want to show you how to draw a dashboard using data stored in Presto!
By default, Metatron Discovery relies on Druid to create charts. But when you cannot create charts you want using existing data source in Druid, that’s a way to use “Linked Datasource”. Below is a simple data flow diagram using linked datasource. In this case, we assume data is in Preto DB.
Presto Table -> Temporary Druid Datasource -> Dashboard
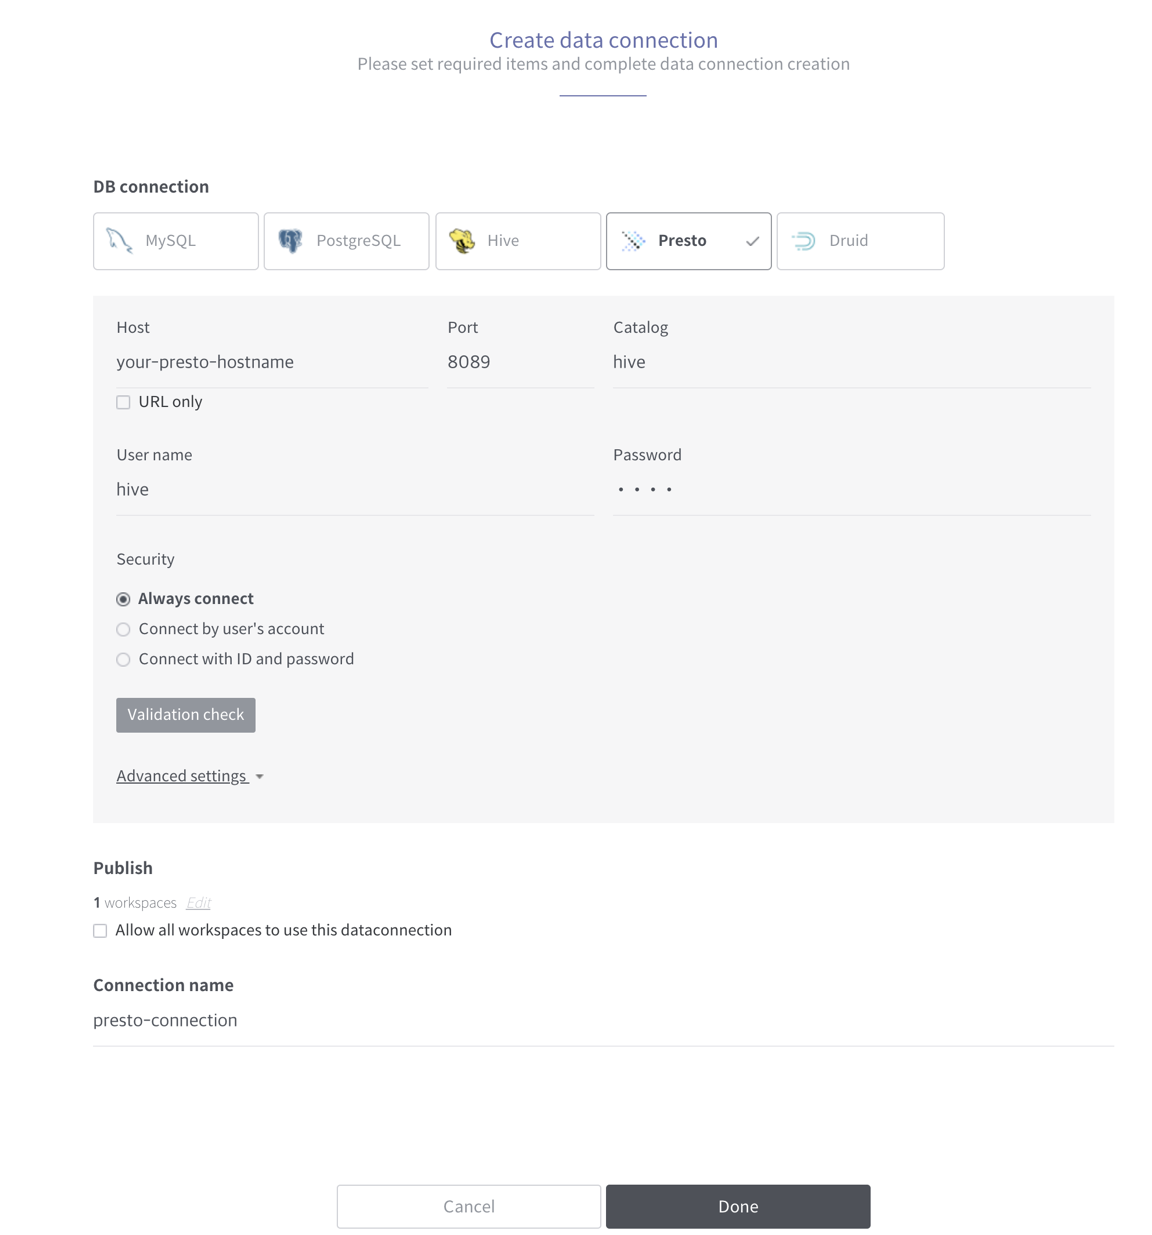
Let’s create a linked datasource using the data that exists in Presto. First of all, create a data connection for your Presto. Go to Data Management -> Data Storage -> Data Connection and create a new data connection.

[Setting Presto connection]
Enter Presto hostname, Port, Catalog, user name and password as above. Also you need to name the new connection and click save.
Now we need to test SQL queries in the Metatron workbench to make sure this connection works. Since we are using our demo site, the generated Presto connection has been shared with the “metatron” account.
Log-in our demo site with test account(ID and PW are “metatron”) and create a new workbench. You will see a screen to select the data connection as shown below. Just select Presto-metatron-hadoop-01 connection.
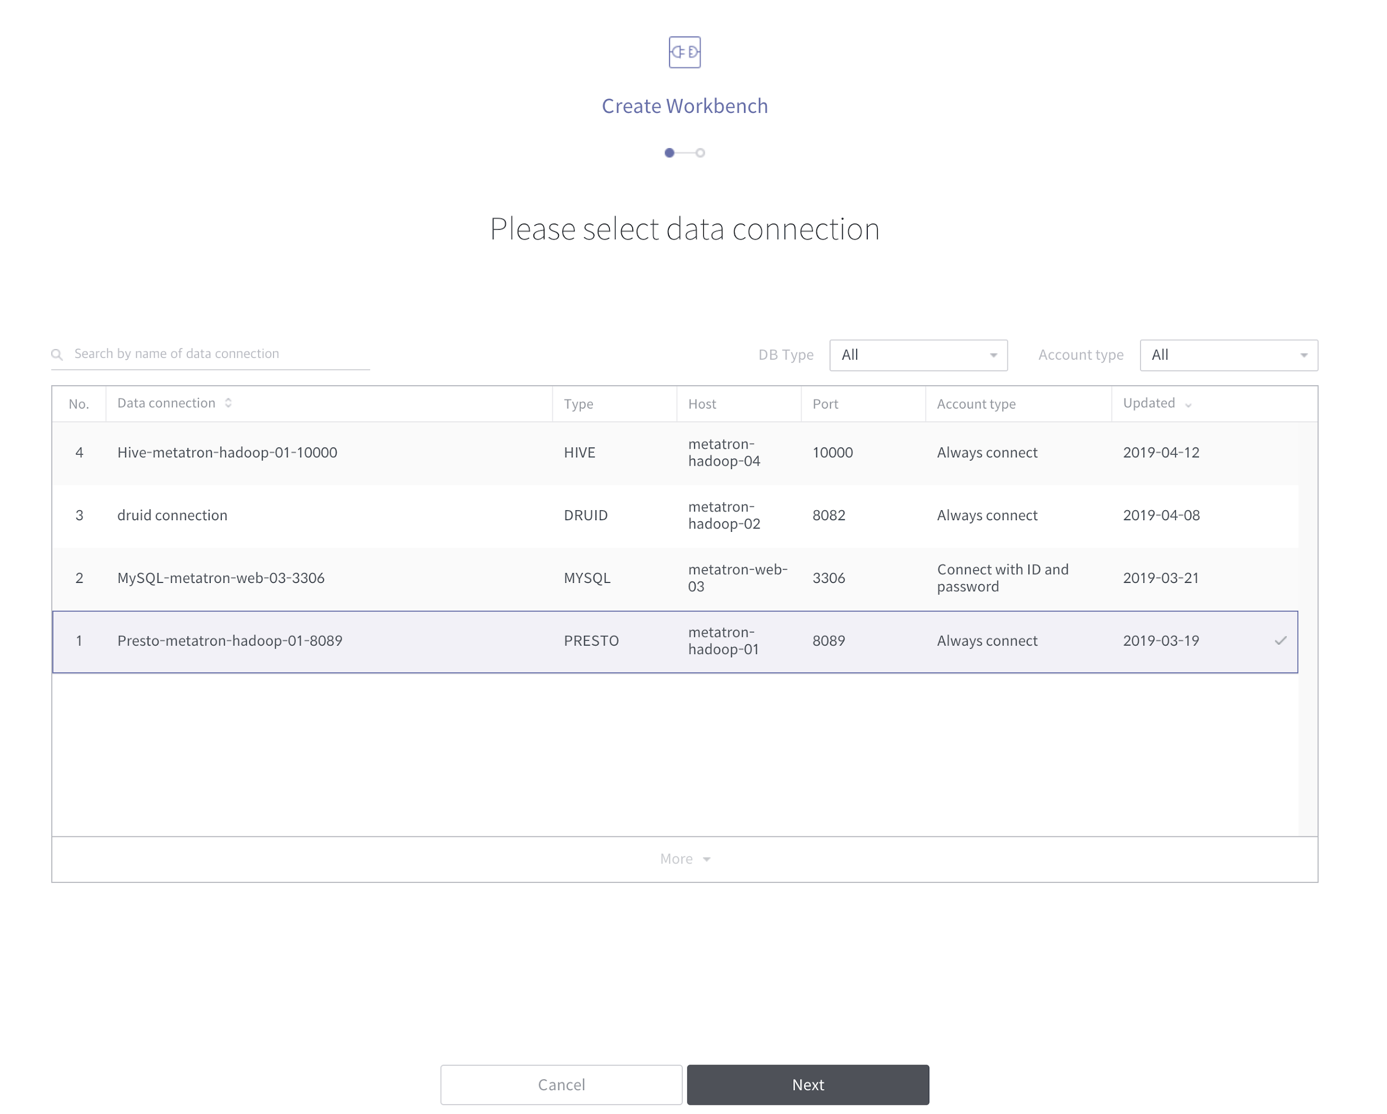
[Select Data Connection]
Now create a simple SQL in the workbench and check the results. The table to be used here is “access_log_table” in the “metatron_weblog” database. Simply perform the following SQL query:
Select * from metatron_weblog.access_log_table;You can see the results of the query execution as shown below, and you can also create a chart simply by putting the results in Druid’s temporary datasource in the workbench as well.
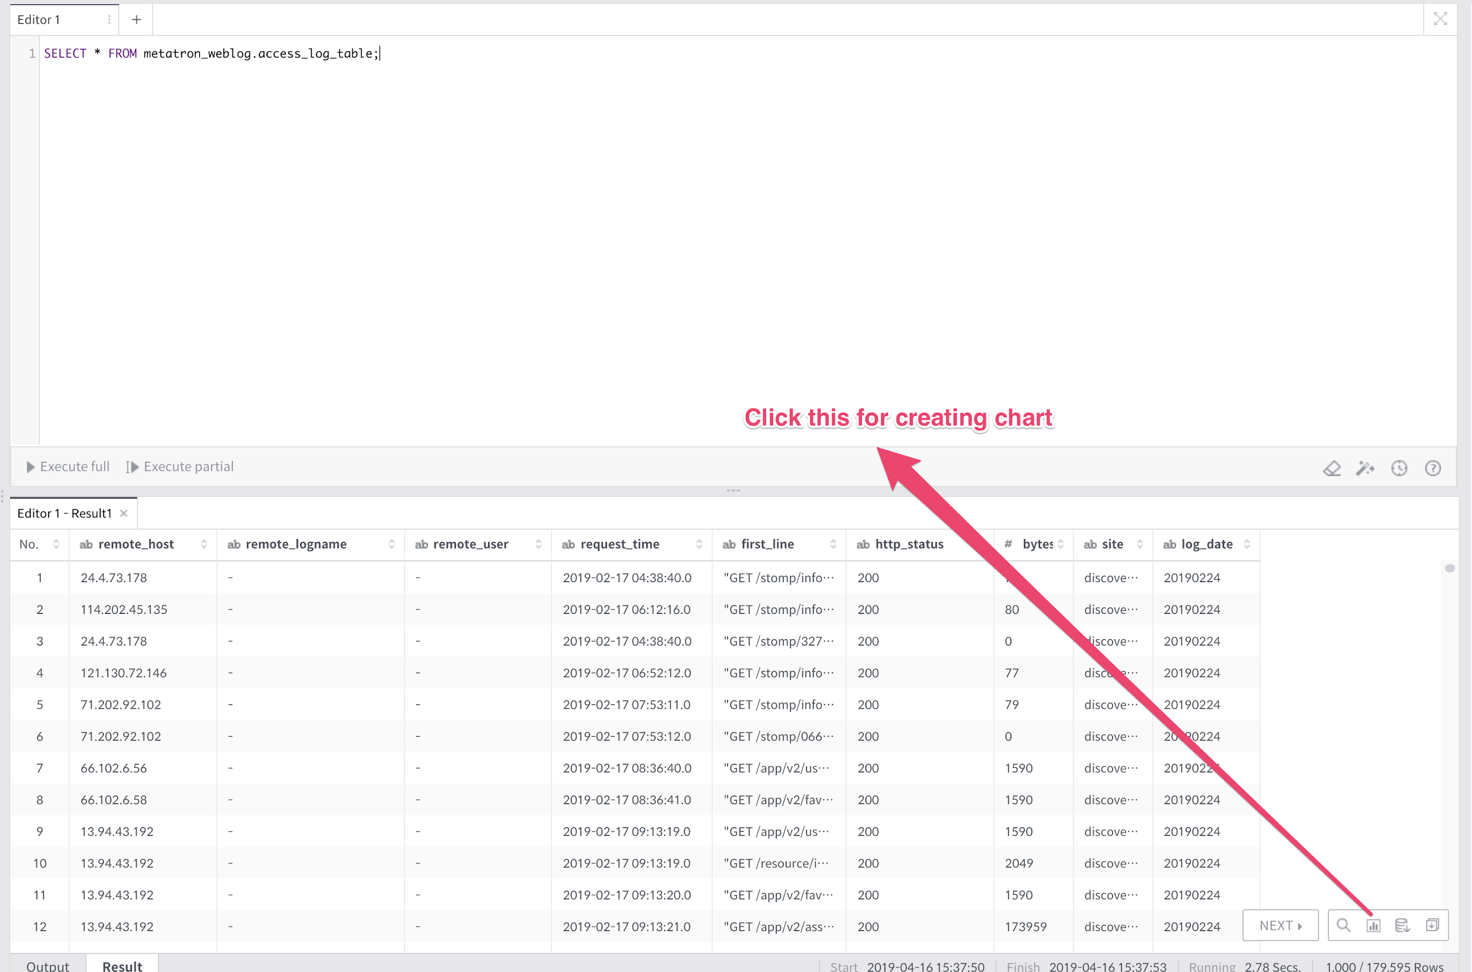
[Create a chart with query result]
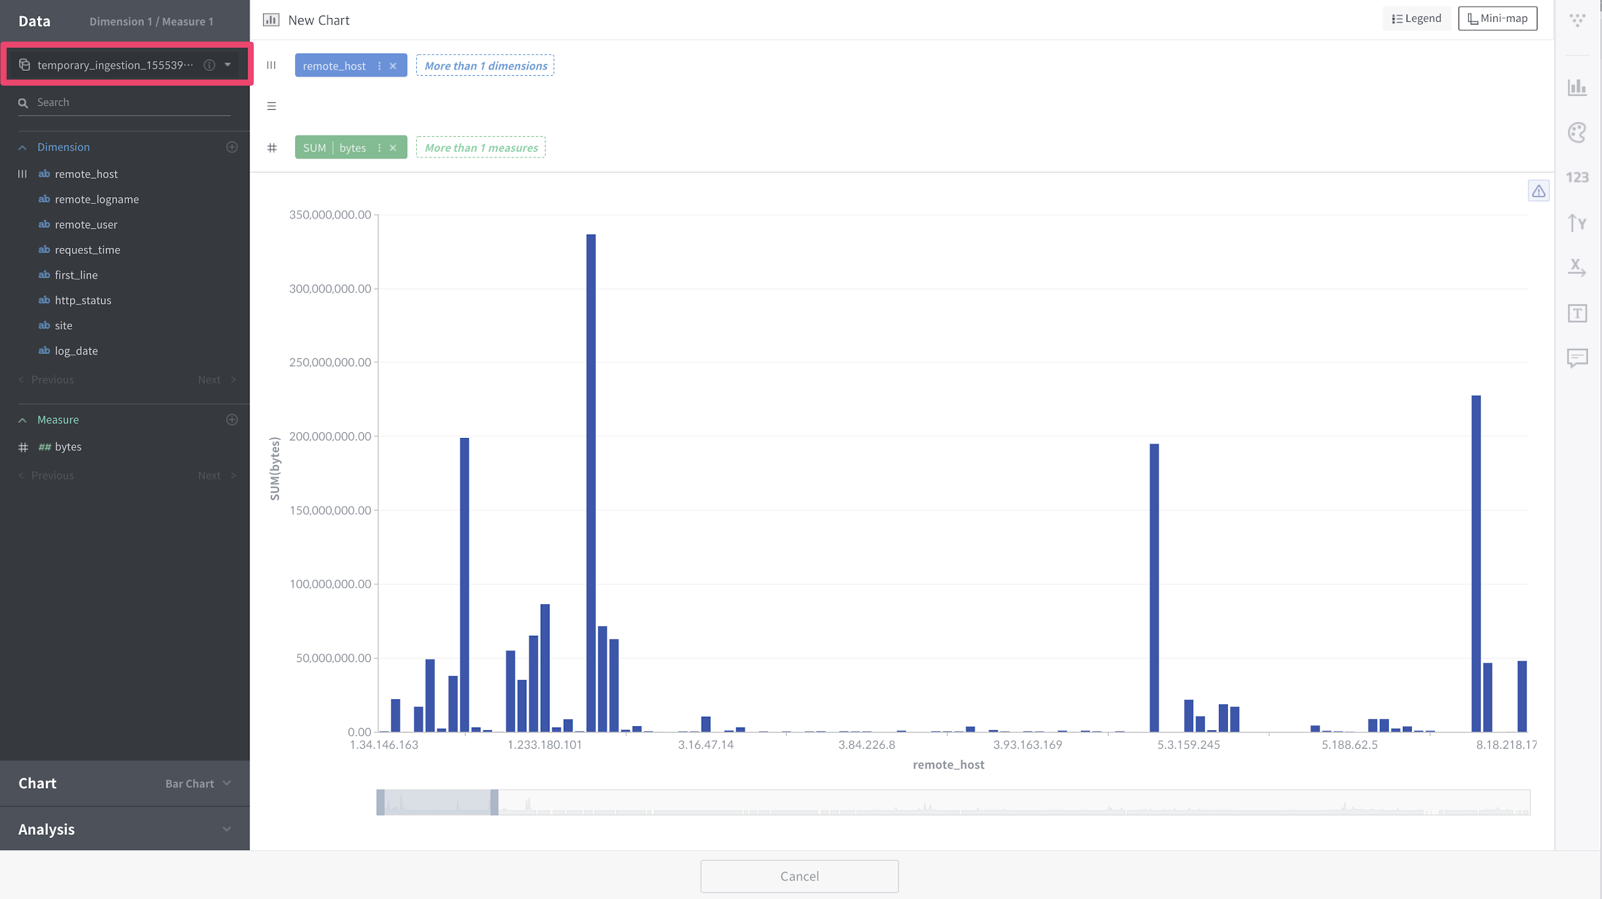
[Druid’s temporary datasource]
It’s time to create a linked datasource. To create, go to Data Management -> Data Storage -> Data source and click the button “new datasource”. Select Database as the Source type.
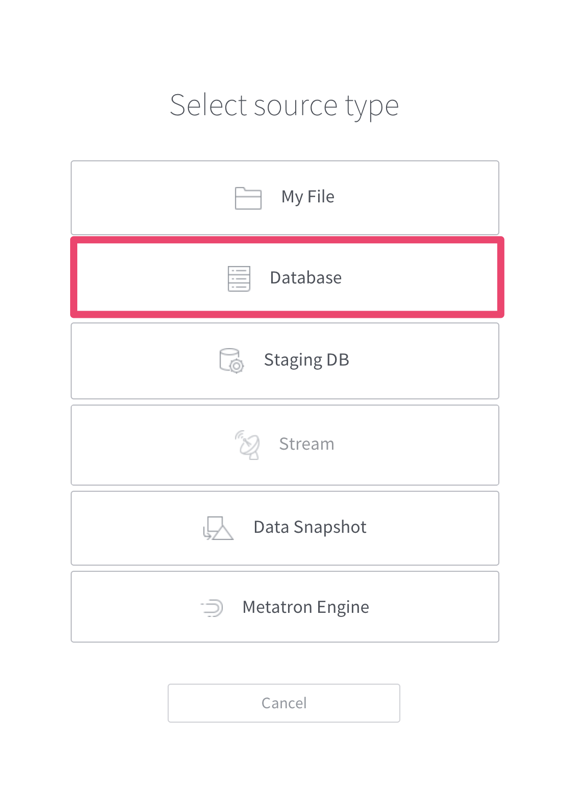
[Select source type]
Next, you need to select Data Connection. Set the Ingest type to “Linked data” and select the “Presto Data Connection” we created earlier.
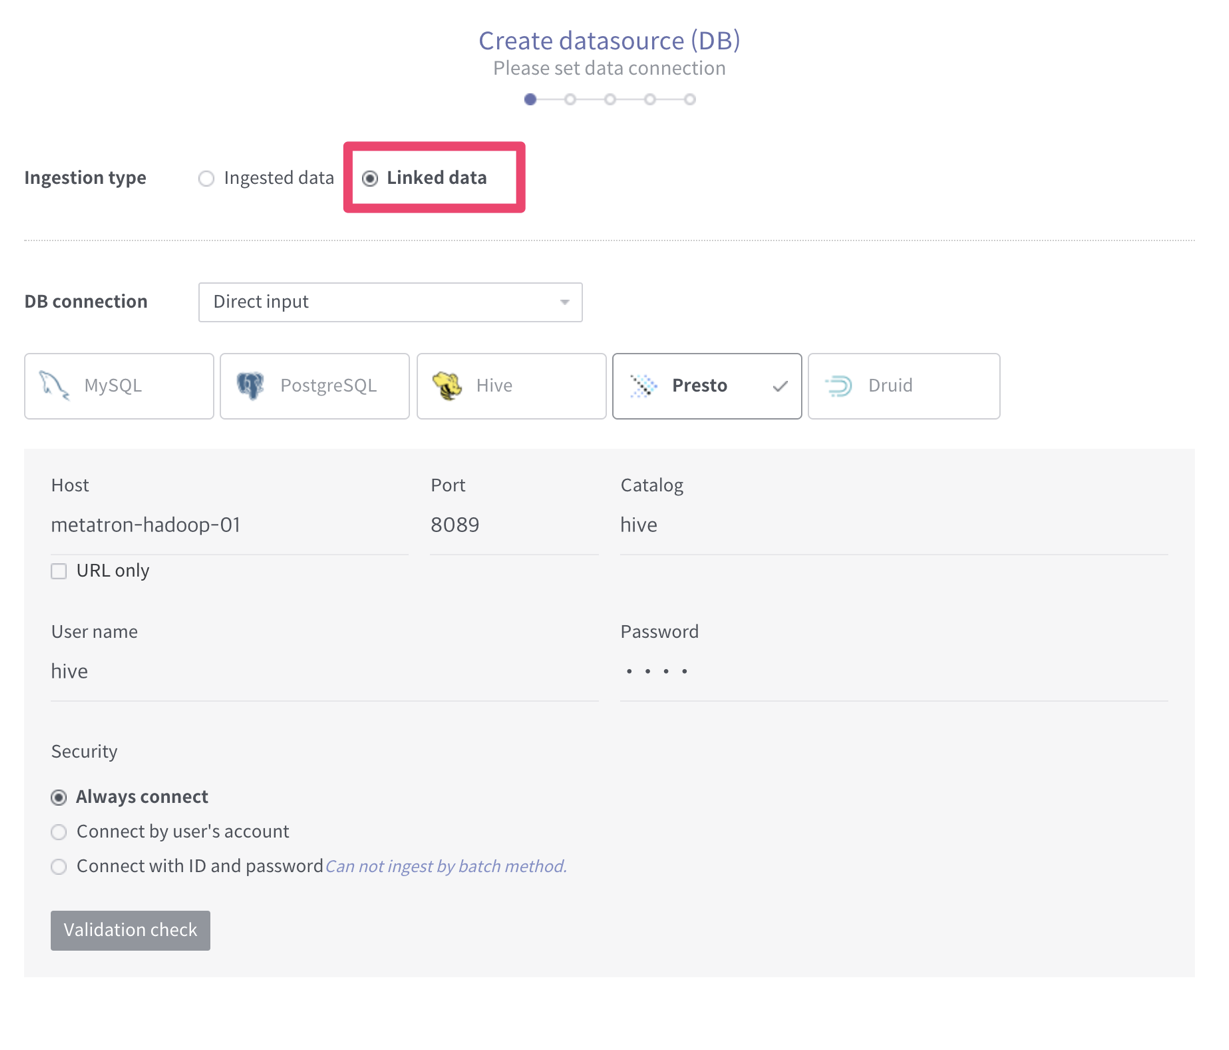
[Configure data connection]
After that, select the data you want to visualize. Choose a data table or write your own SQL query to get the data. In this case, we are going to choose table. Select “access_log_table” in the “metatron_weblog” database.
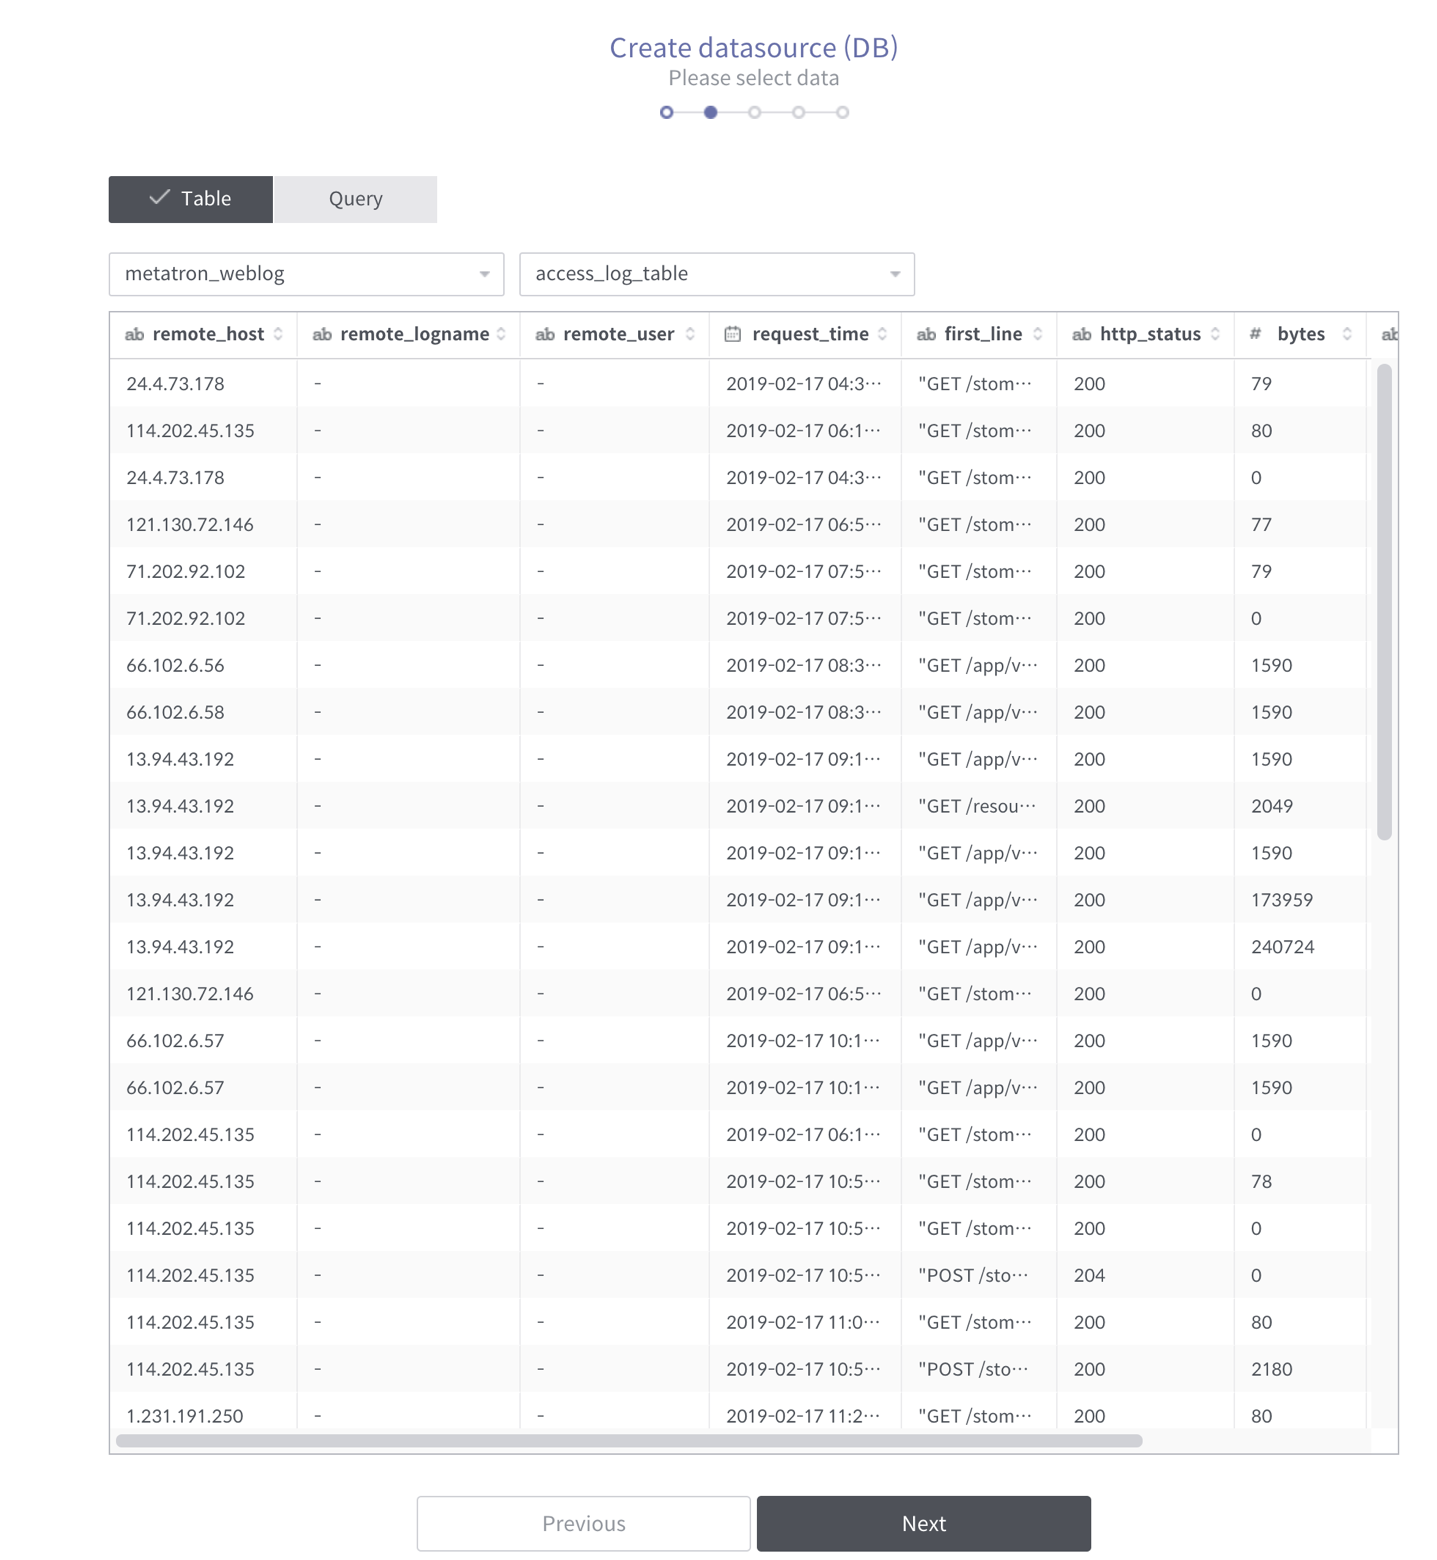
[Preview data tables]
Next is configuring the schema of the datasource. Because Presto already has a schema, you don’t have much to do. Set all the settings to the default values already set, change only the request_time and log_date to the “Date / Time” type, and select the Time-type column as the request_time.
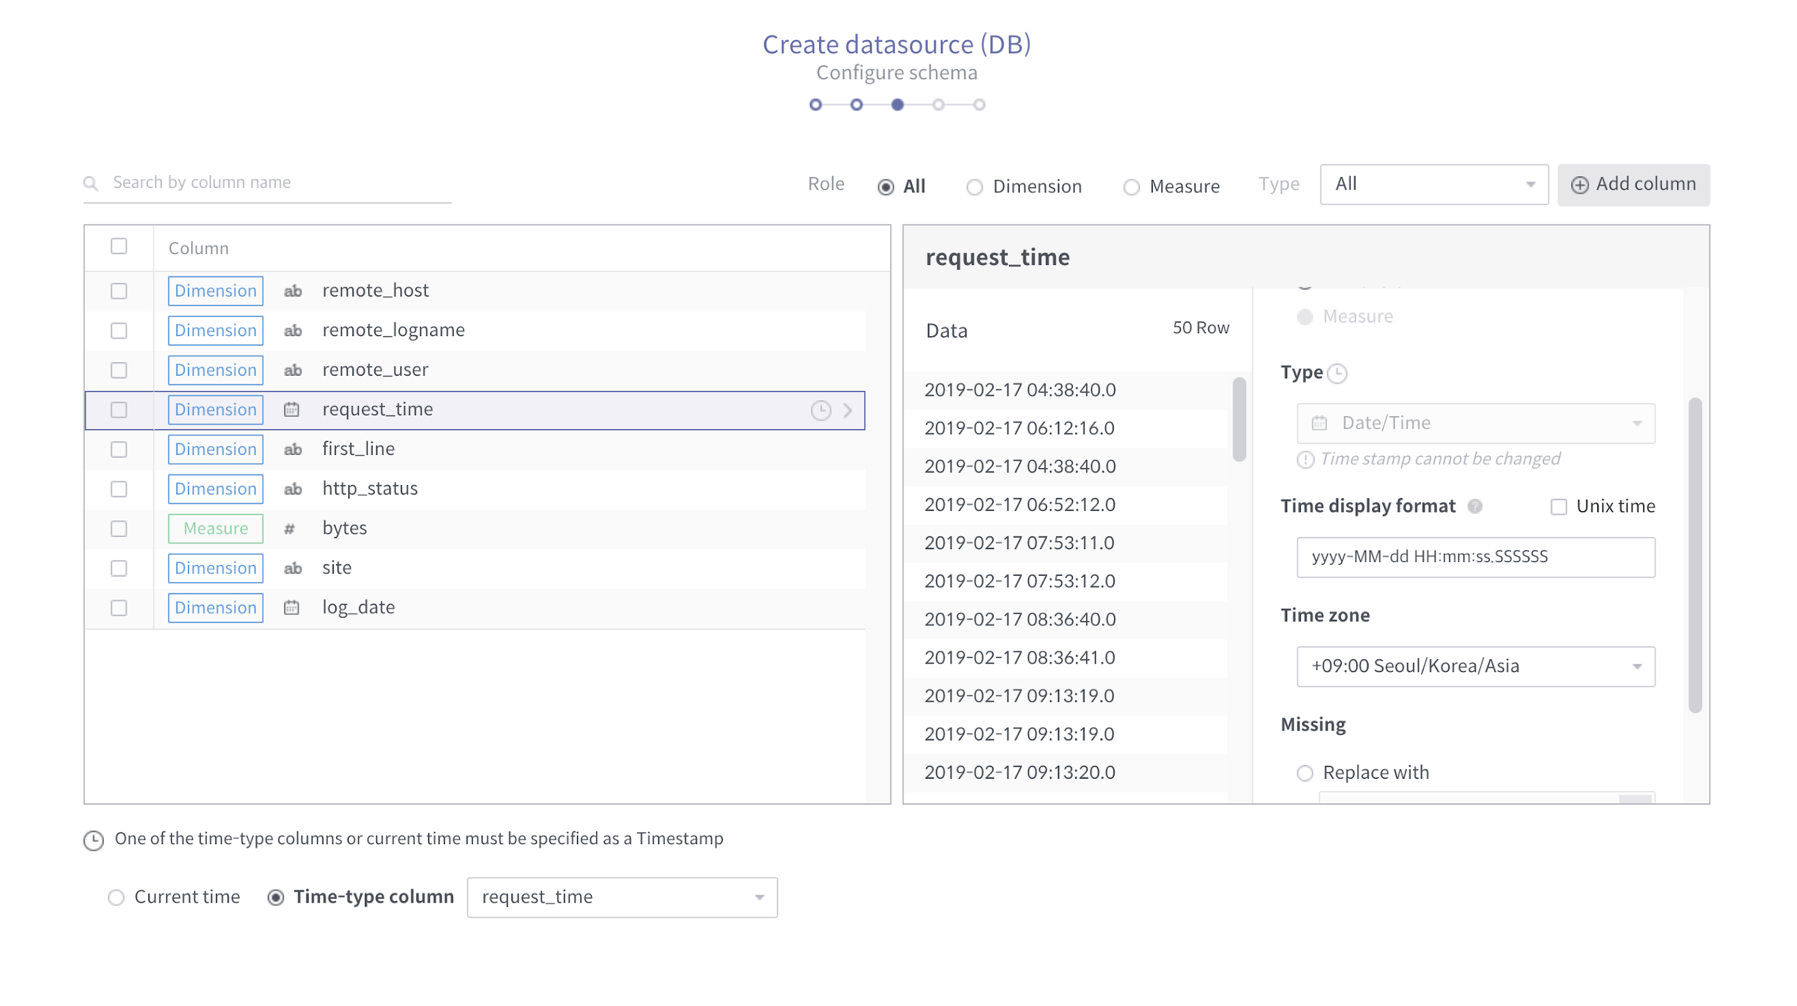
[Configure schema]
Finally, we need to configure to ingest data into the temporary datasource of the Druid. First, set the time to hold the temporary datasource in memory to 1 hour.
And then set “Query Granularity” to Second, “Segment Granularity” to Hour, and “Rollup” to false.
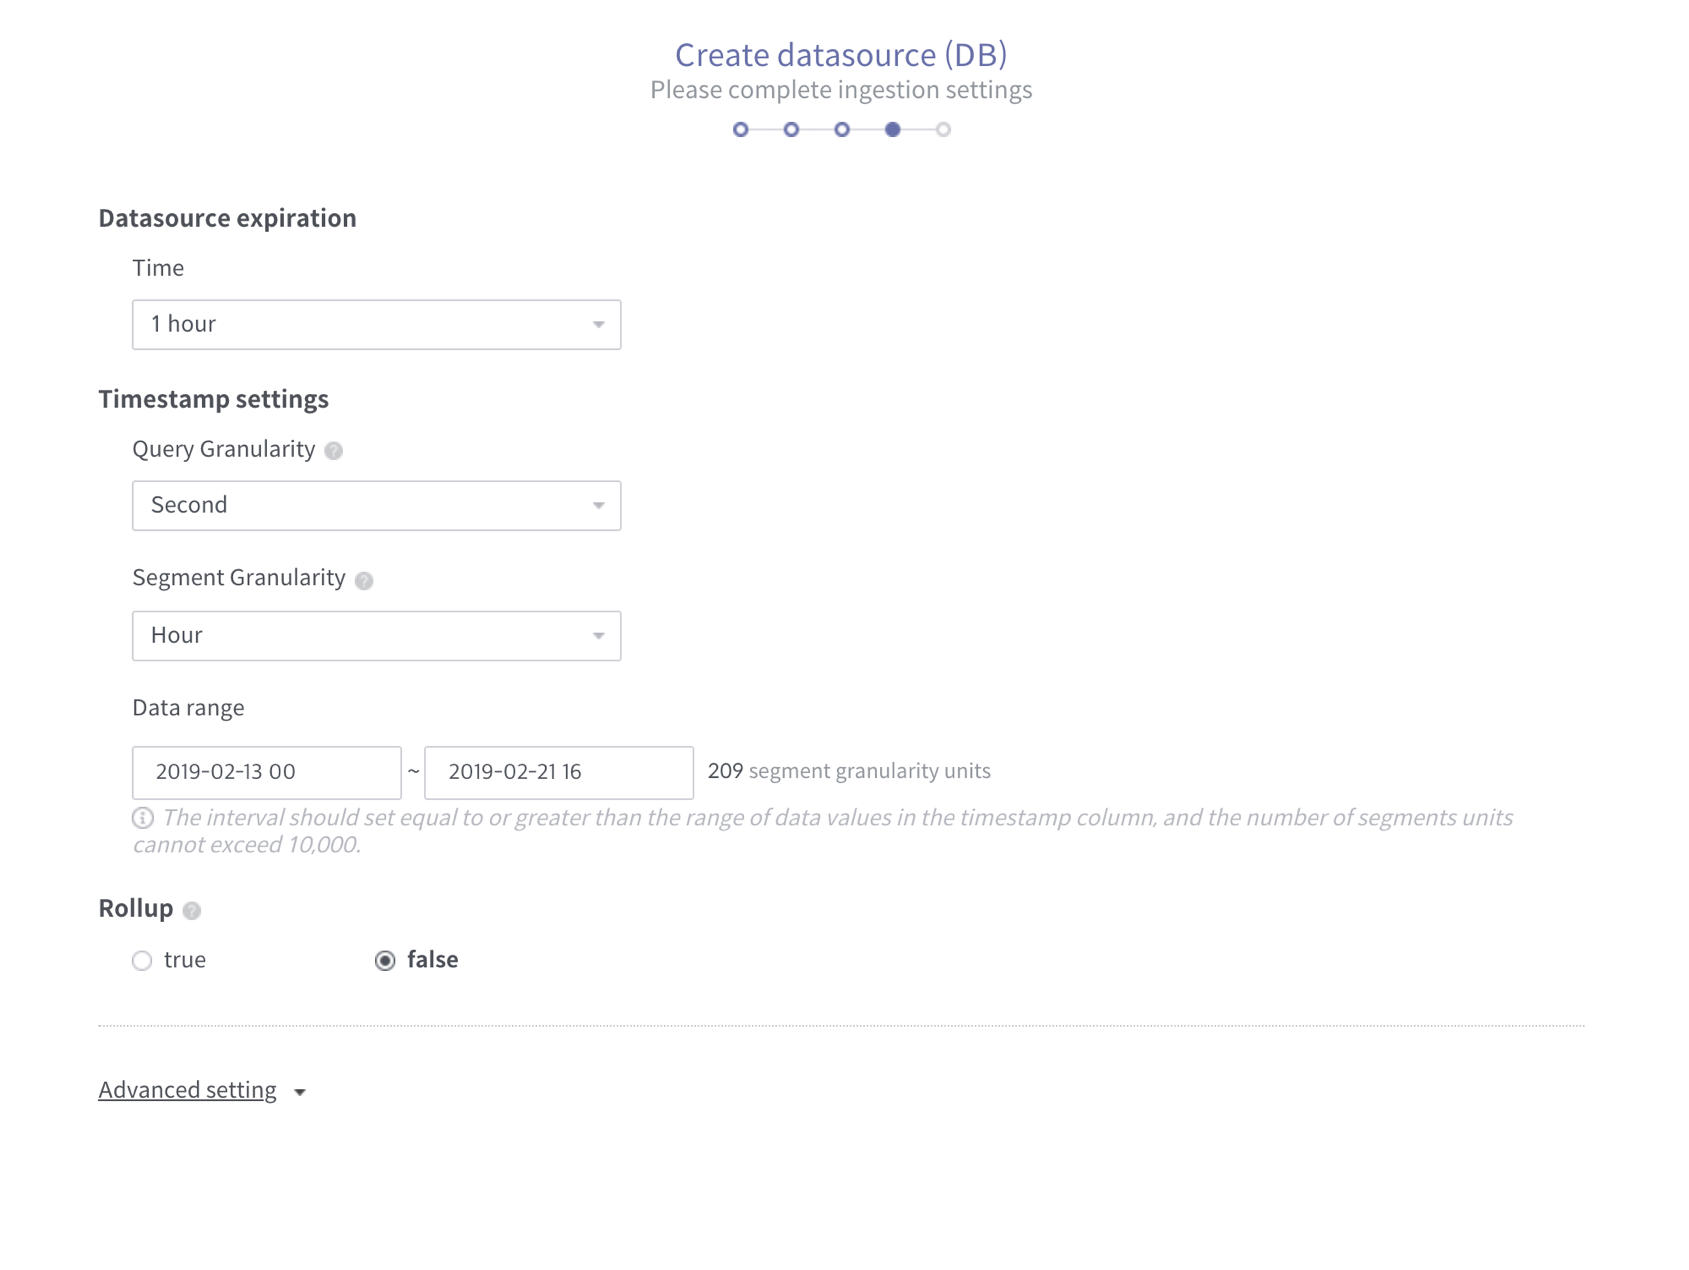
[Configure Druid ingestion]
Now you have finished all the steps to create a linked datasource. Name the data source and finish creating the datasource. Linked datasource does not have ingestion process, so it is generated immediately.
Finally, only the most interesting time left! Let’s build a dashboard with the datasource. Create a workbook and create a dashboard right after that. Select the pre-created linked datasource.
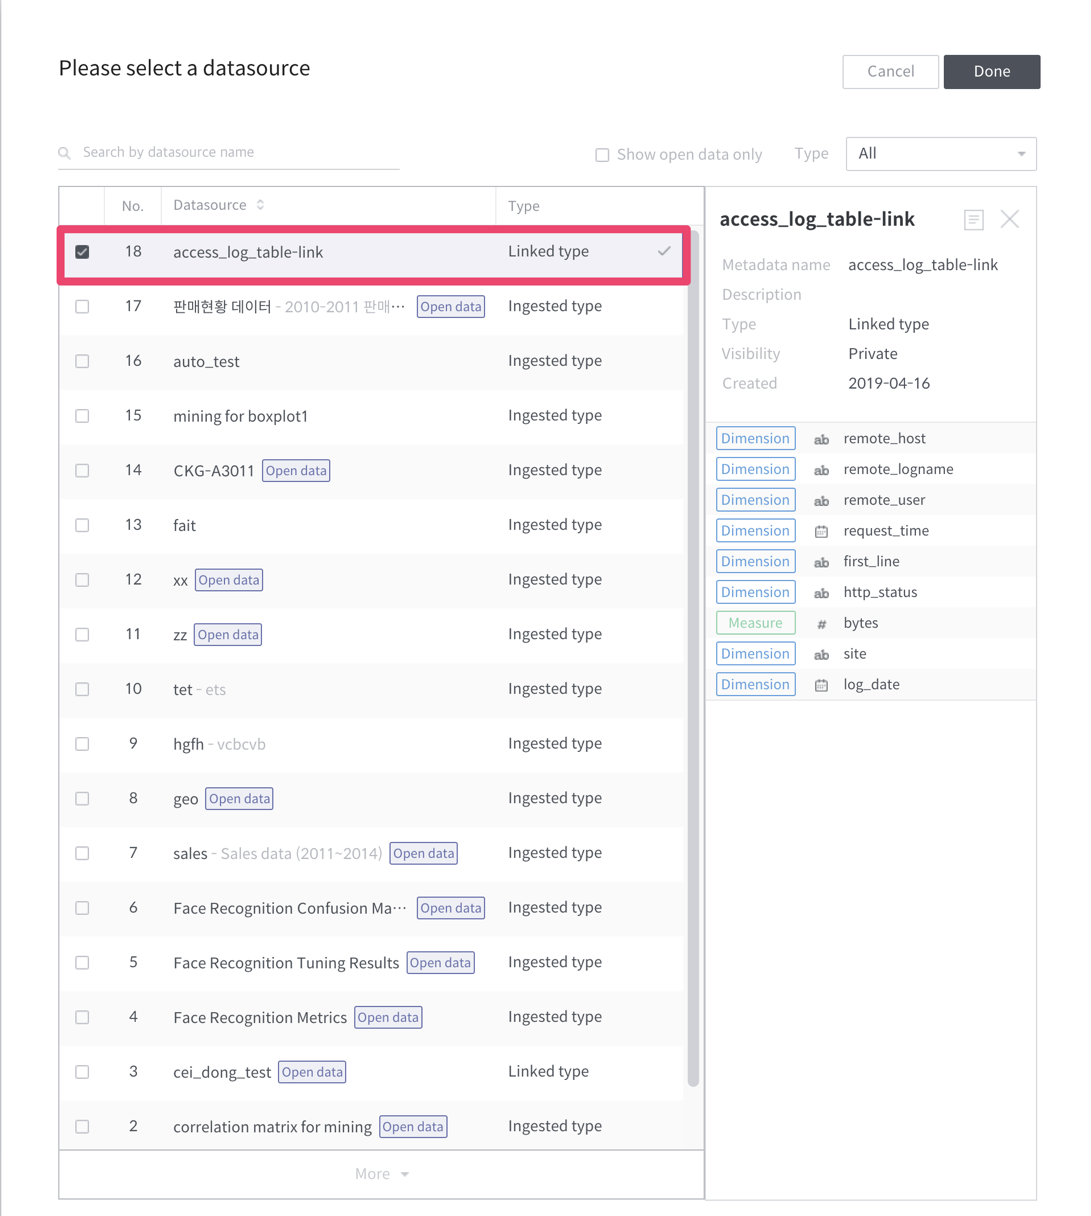
[Select linked datasource]
The rest of the process is the same as creating the dashboard. A linked datasource is a convenient feature that allows you to view the desired data without having to periodical ingestion job for data source that changes every time.
However, there is a disadvantage in that data ingestion is performed for each query, and temporary datasources are difficult to use for very large data. So you need to be able to use linked datasource for the situation that needs it.
We’ll be happy to answer any questions!
Thanks always.