Using Metadata Management
Notice: Undefined offset: 1 in /data/httpd/www/html/wp-includes/media.php on line 70
Metadata is data about data.
In the previous article, we discussed the importance of Metadata Management (MDM).
Let’s look at how to actually create, manage, and use metadata.
There is two types of users.
- Data Manager (Data Creator)
- Data User (Data Consumer)
Each user goes through the following steps and uses the detailed functions of the MDM.
Data Creator
Data Consumer
Let’s follow the functions listed above with the actual data.
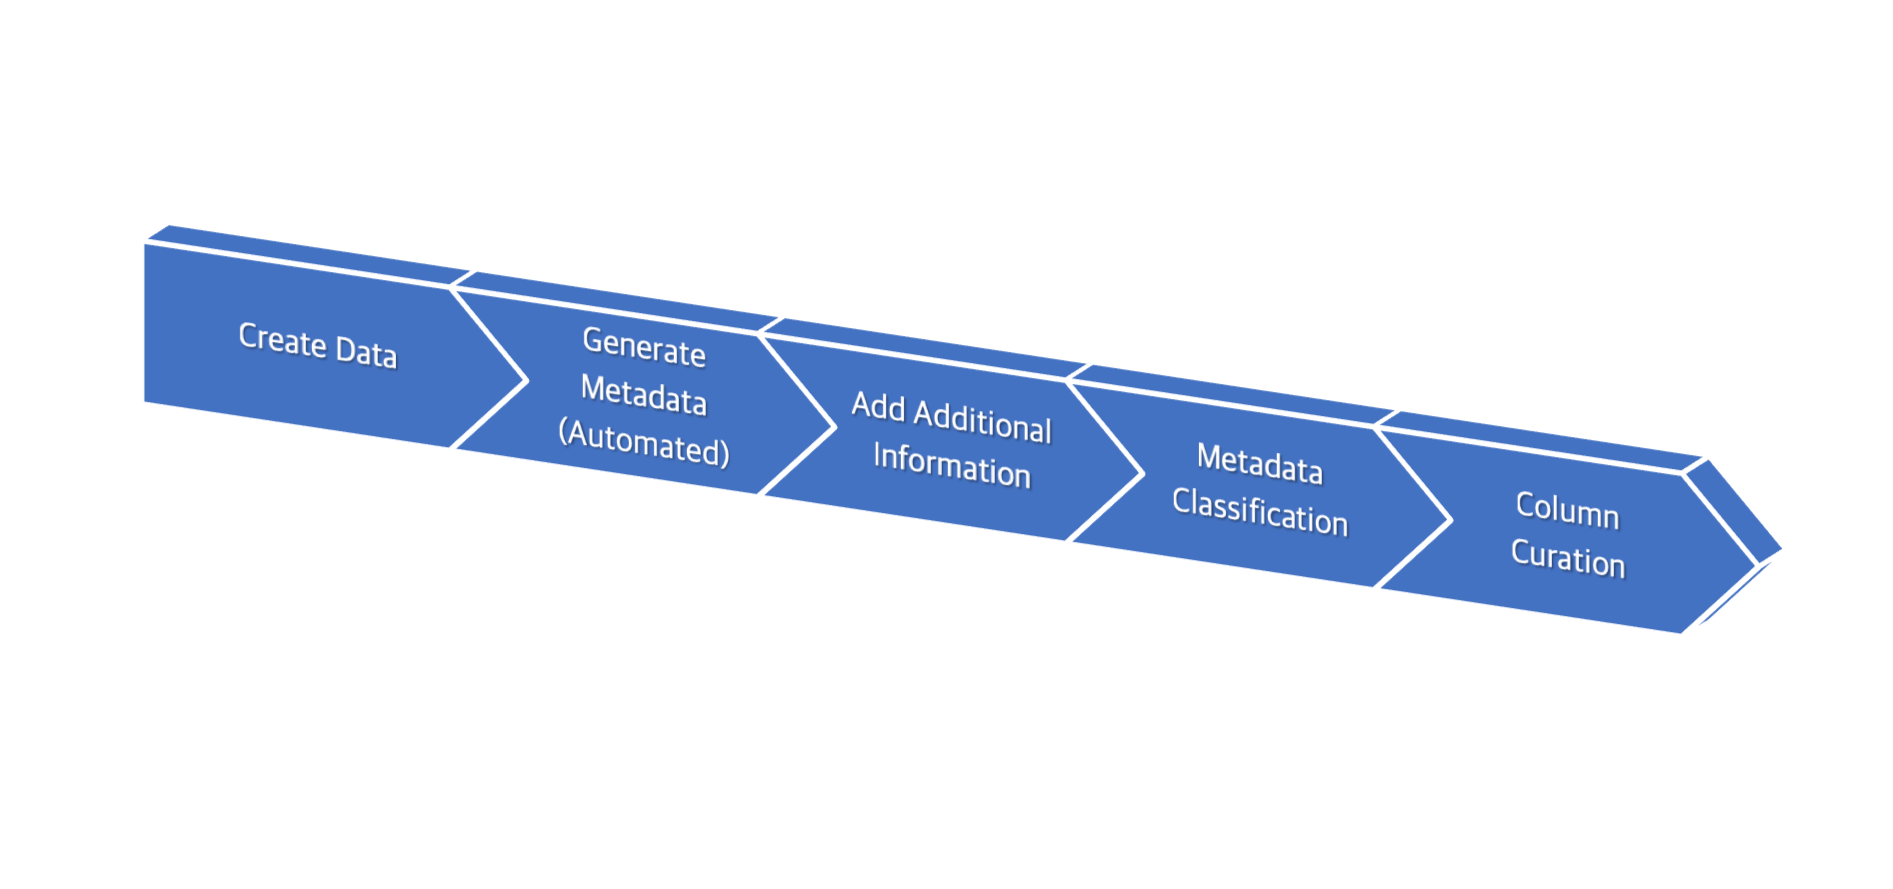
Data Creator
The menu for data creators is below.

1. Create DataSource
Currently, the objects managed by metadata are limited to DataSource and Database. (You can think of it as a physical table.)
This will be extended to various targets in the future.
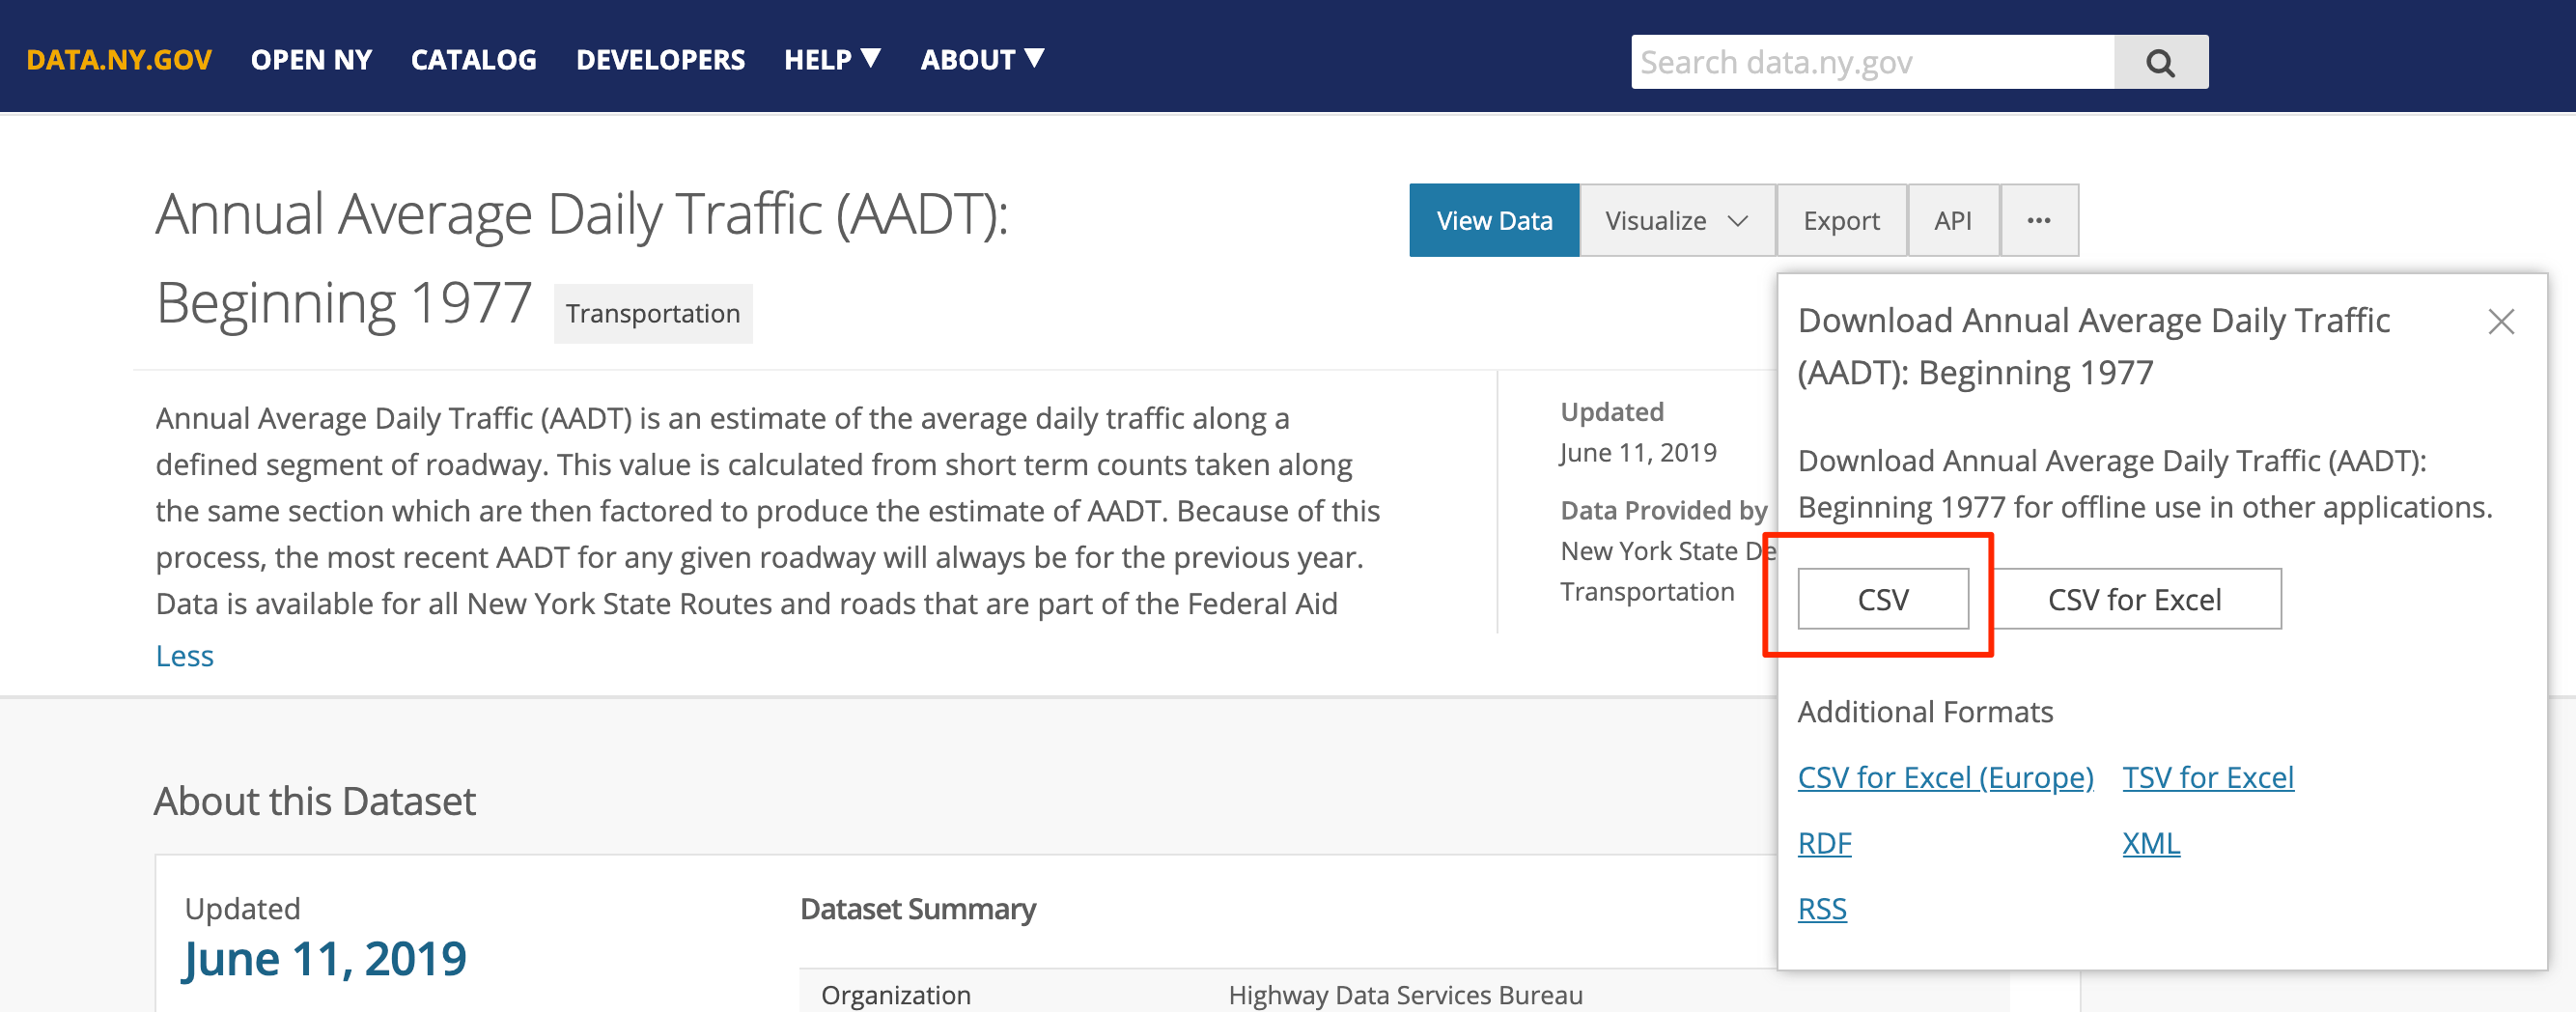
First, create a DataSource using NY Daily Traffic data, which is open data.
Annual Average Daily Traffic (AADT)
Download as CSV
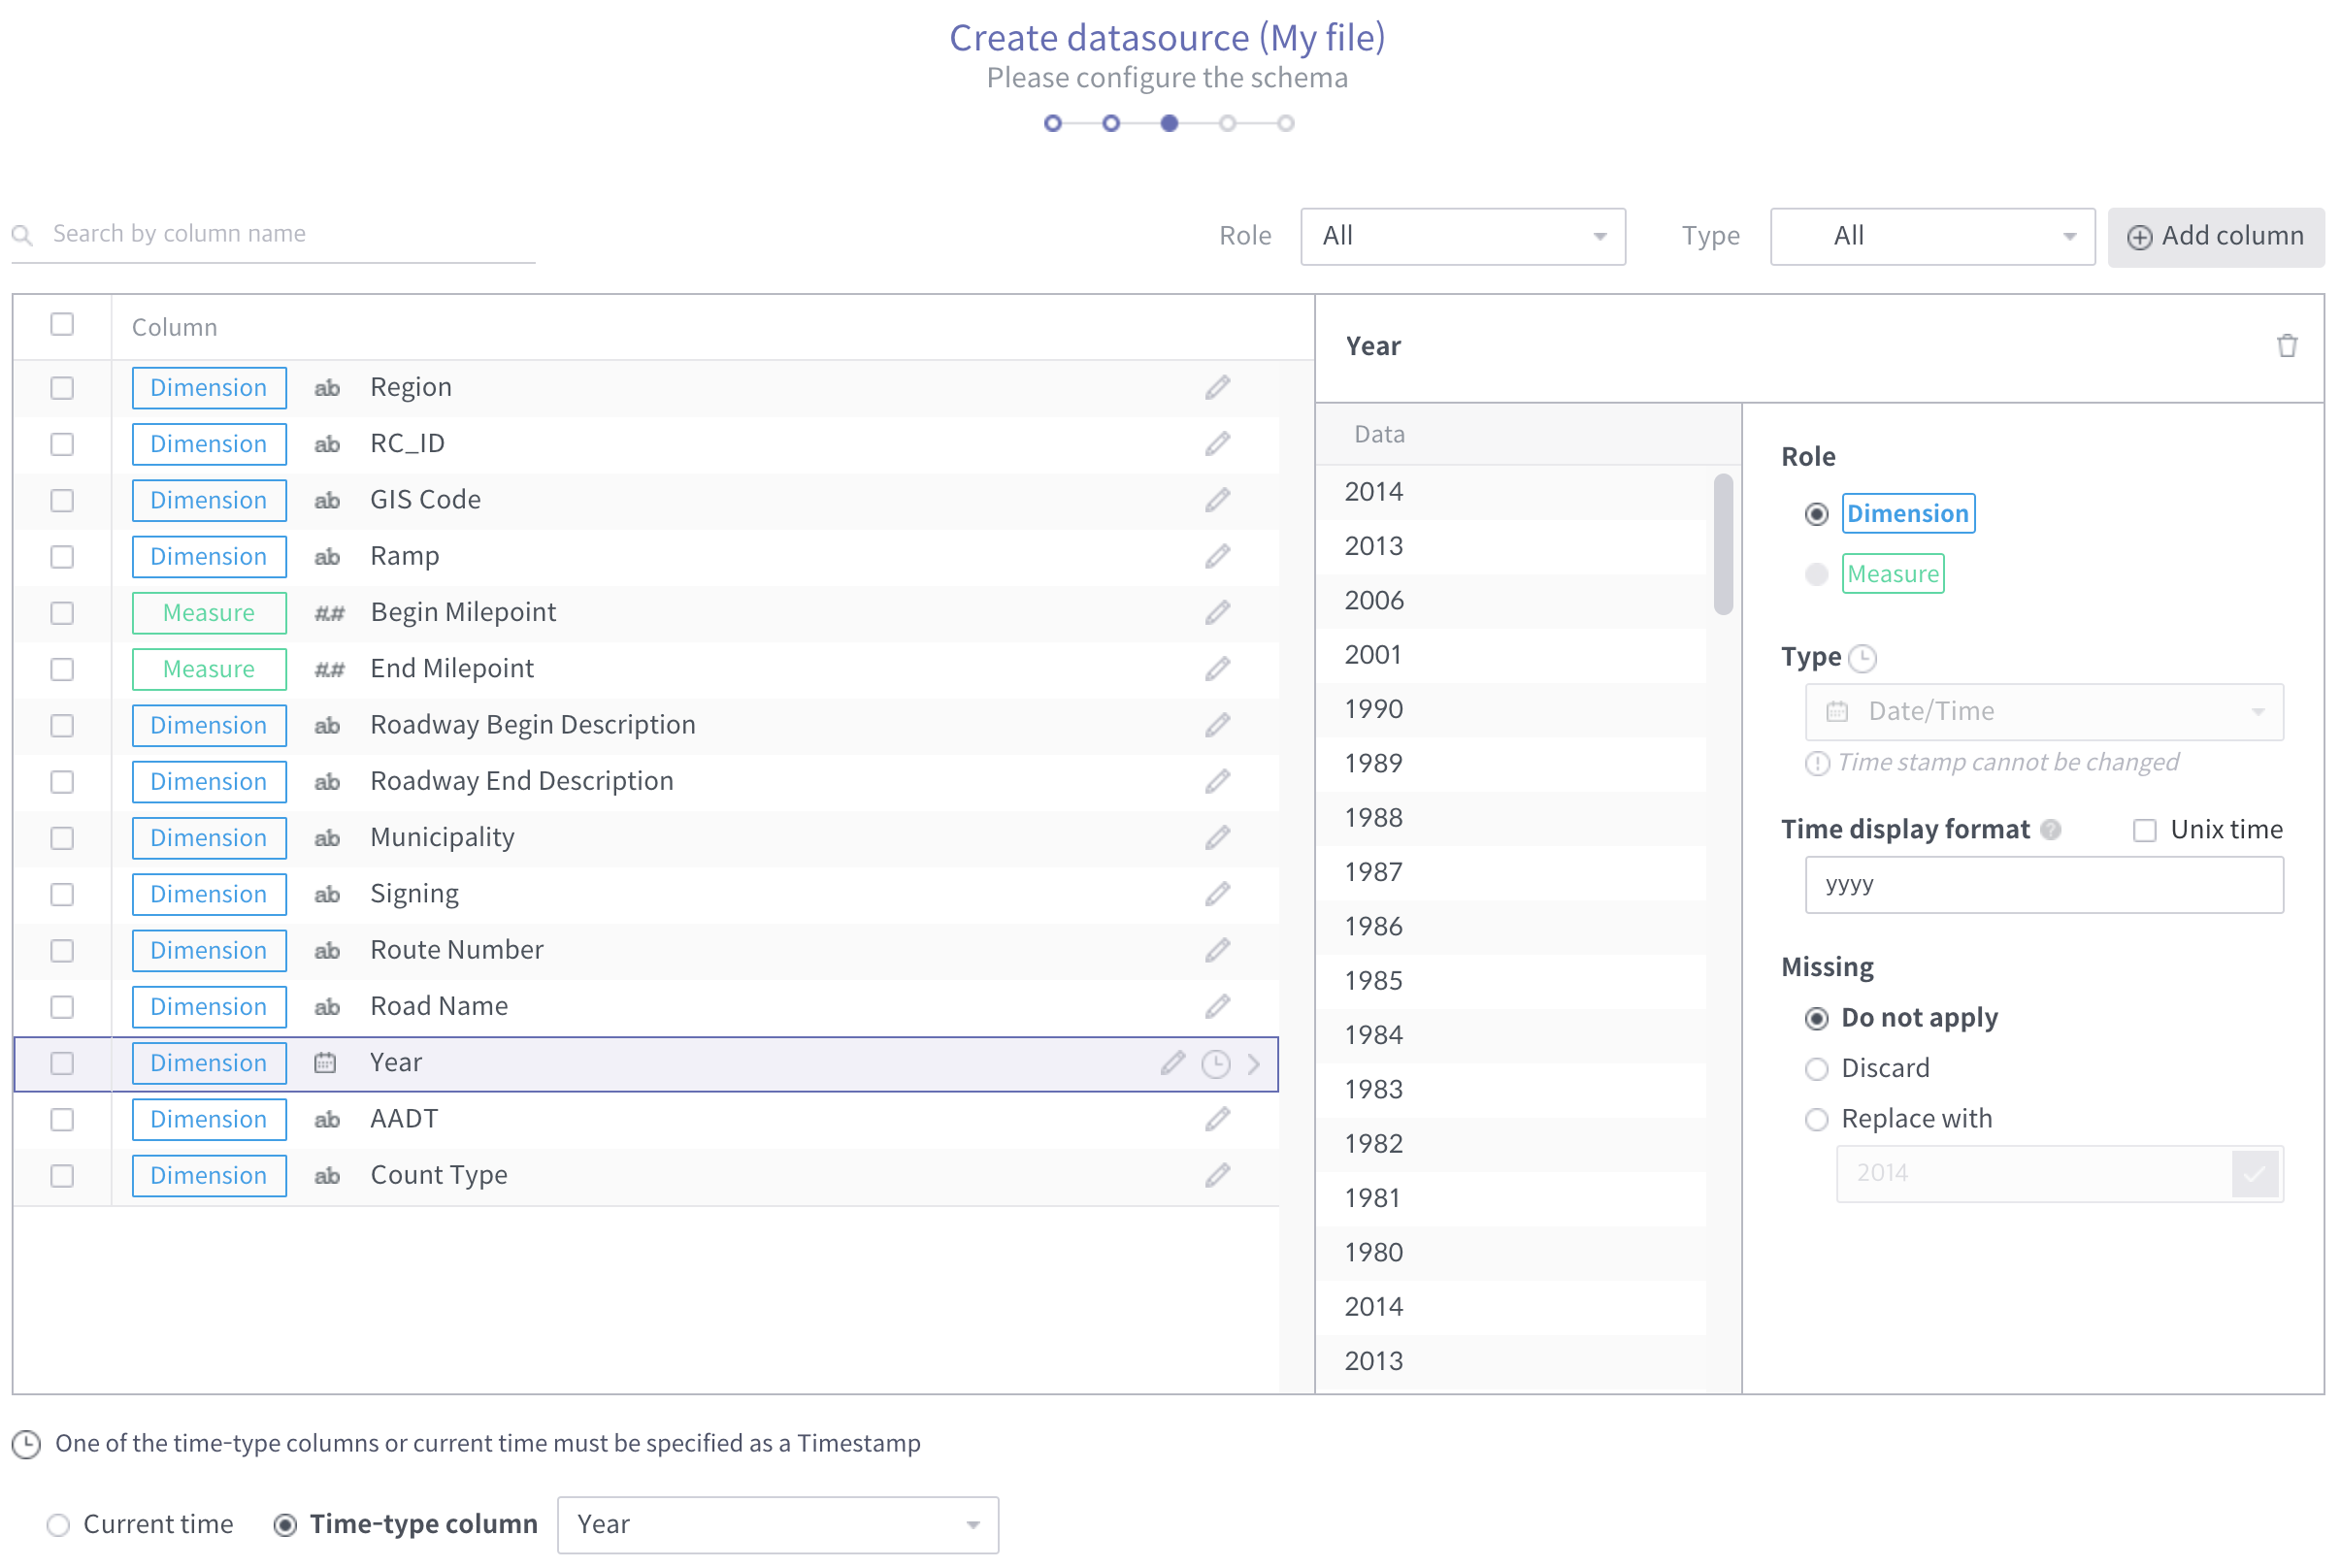
Create DataSource
We created the ‘AADT’, ‘Begin Milepoint’ and ‘End Milepoint’ columns as Measure (Decimal) and the ‘Year’ column as Date/Time type.
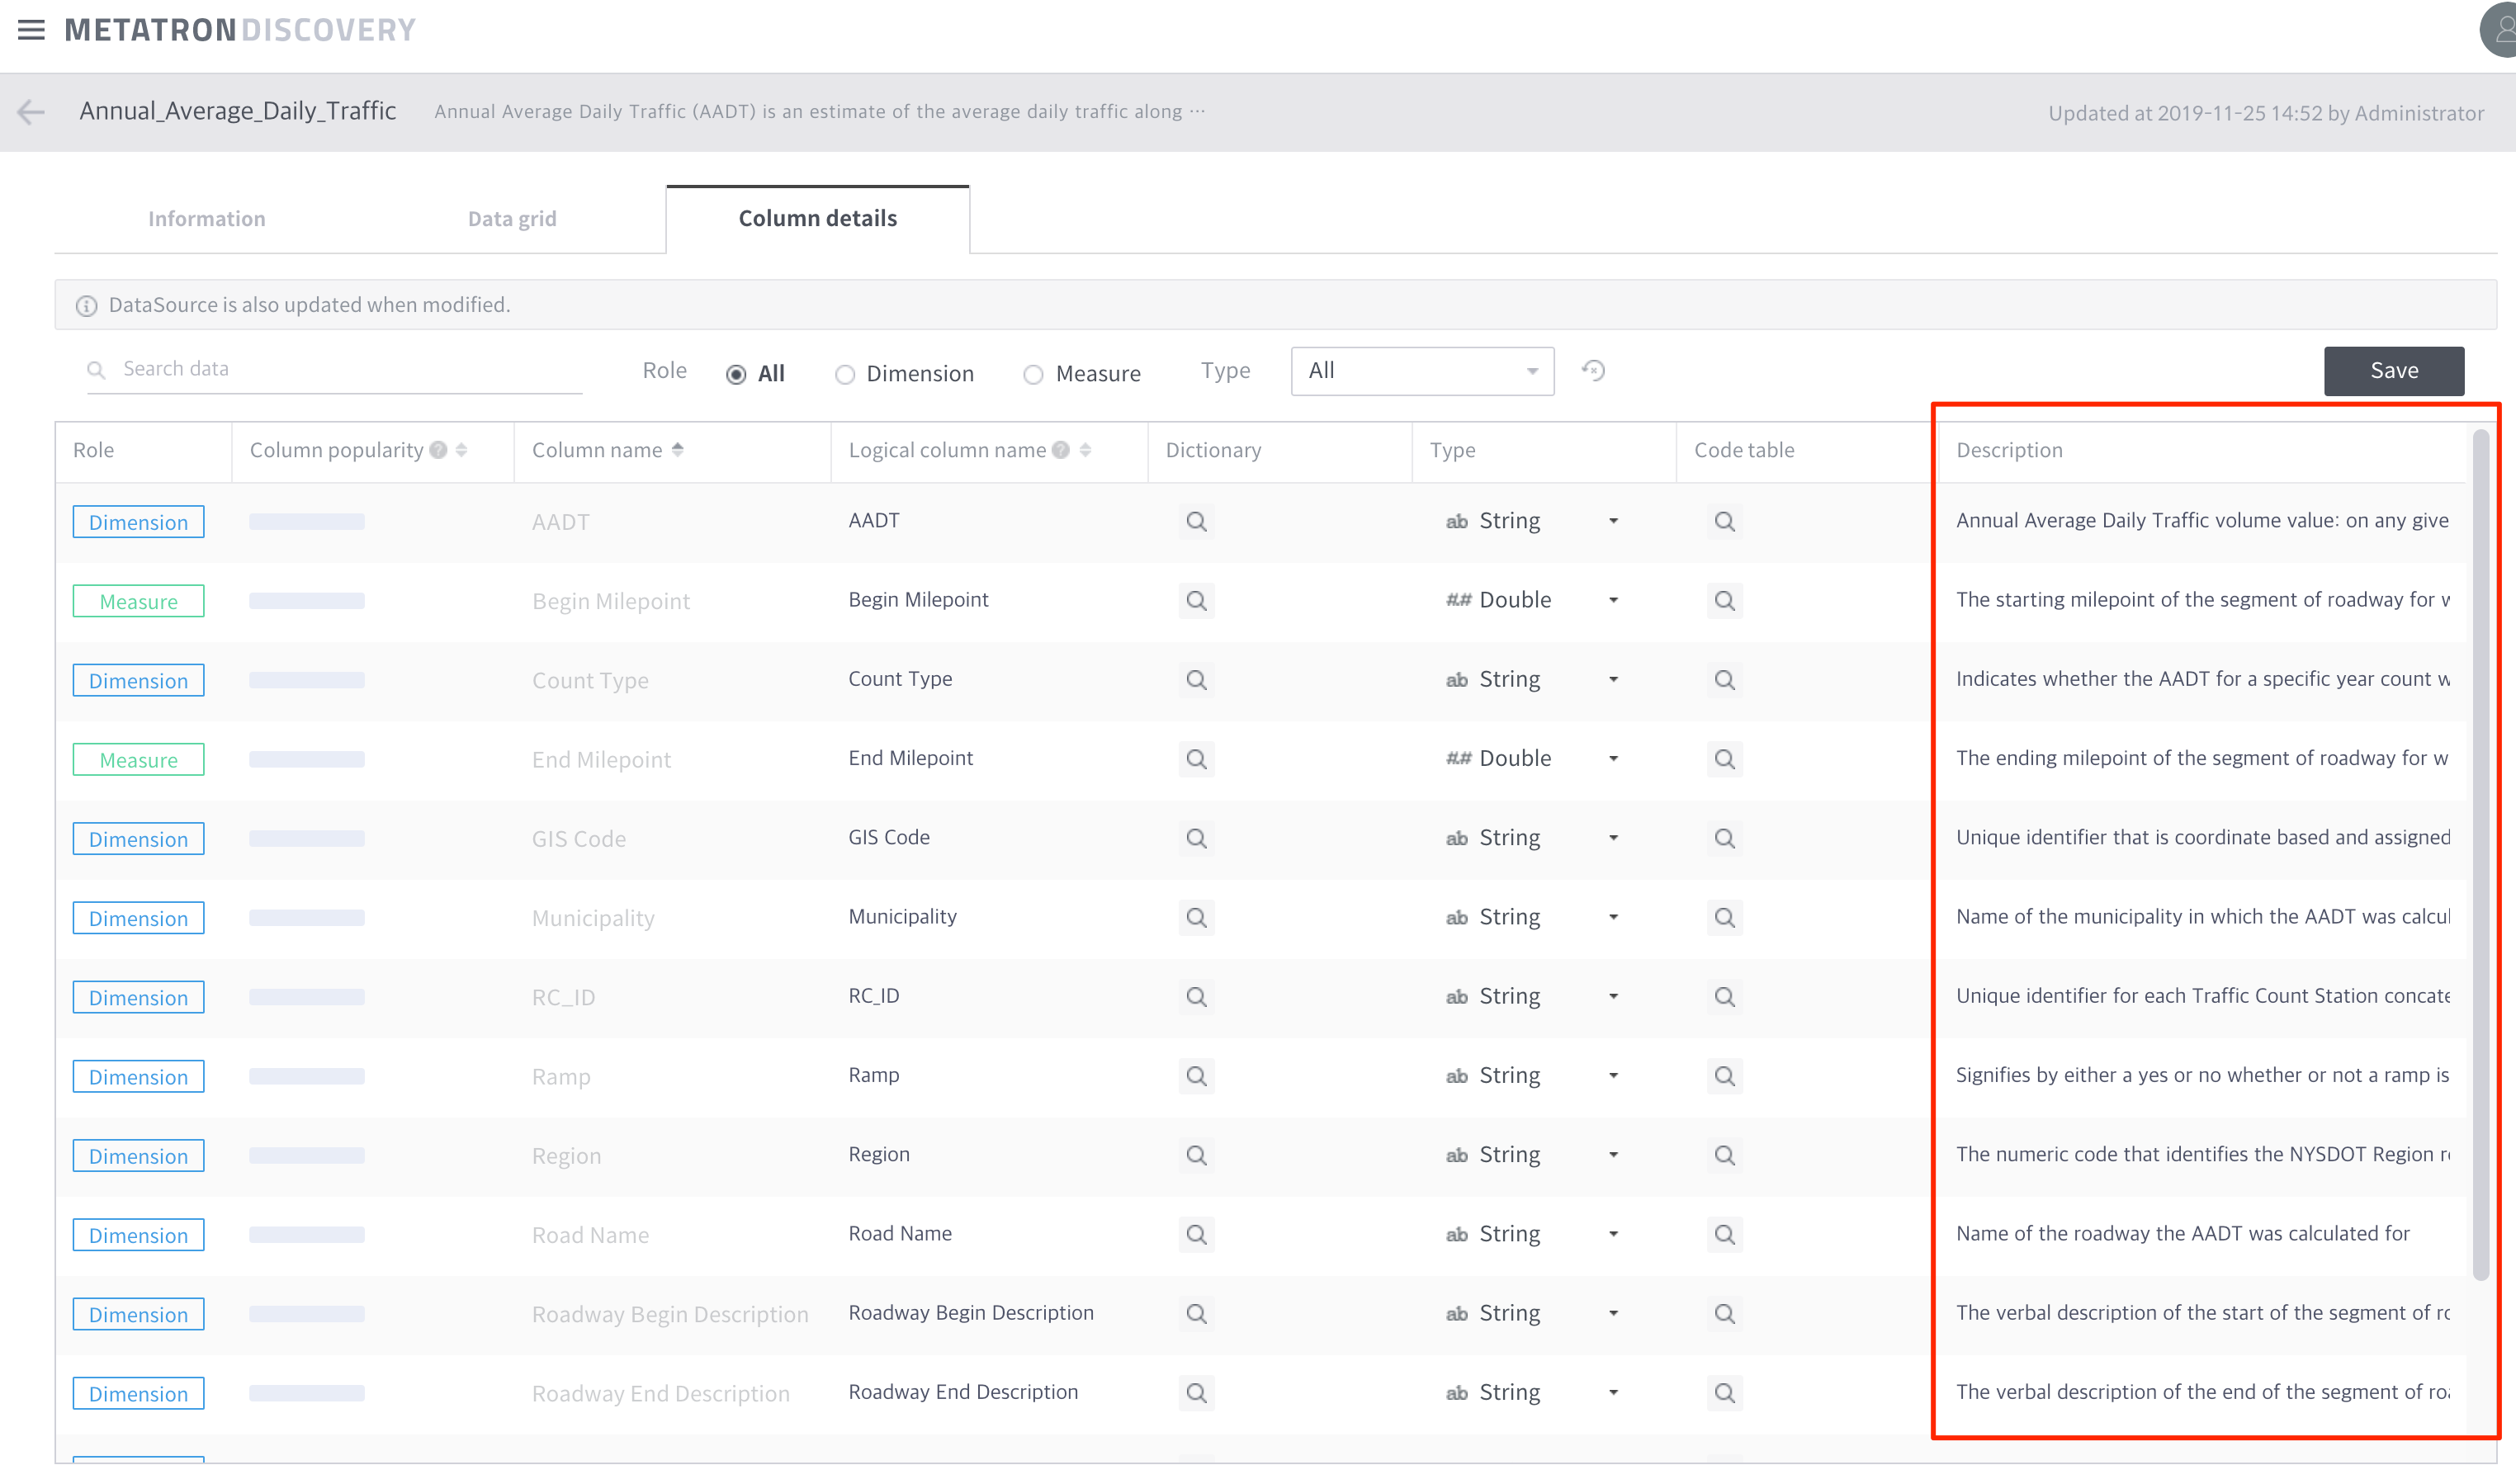
2. Automated metadata generation
When the data source is created, the metadata is automatically created. You can check the metadata information by clicking the “Go to Metadata” button on the top right.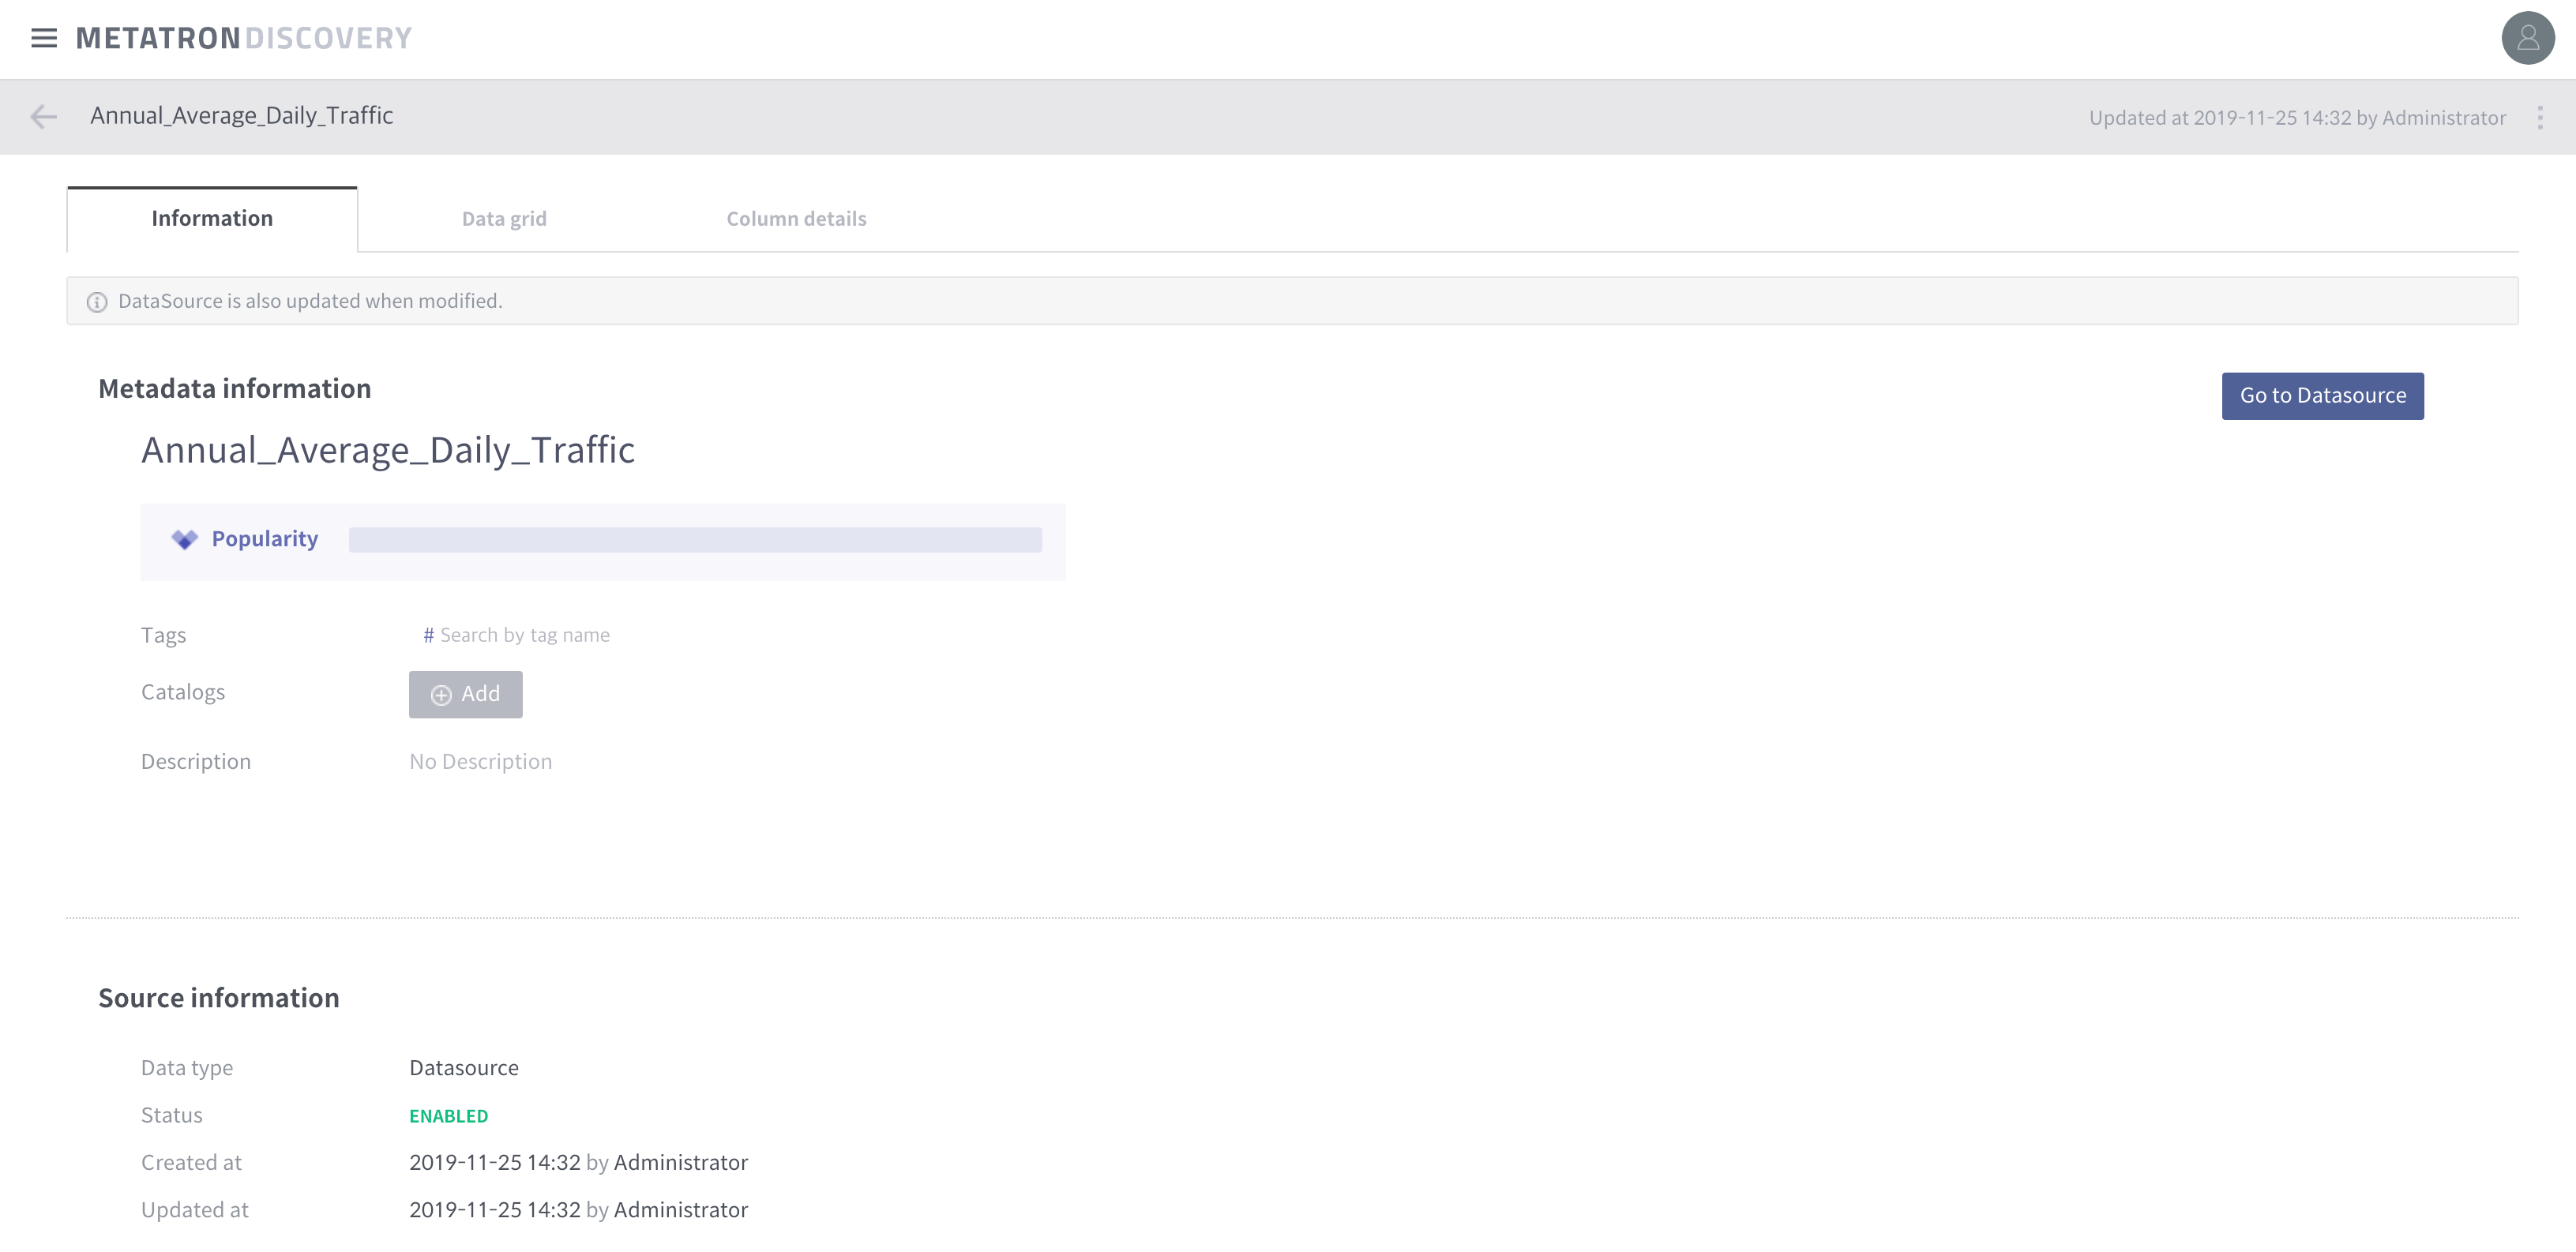
You can find basic information in the Overview tab, Datagrid tab and Column details tab.
3. Add additional information
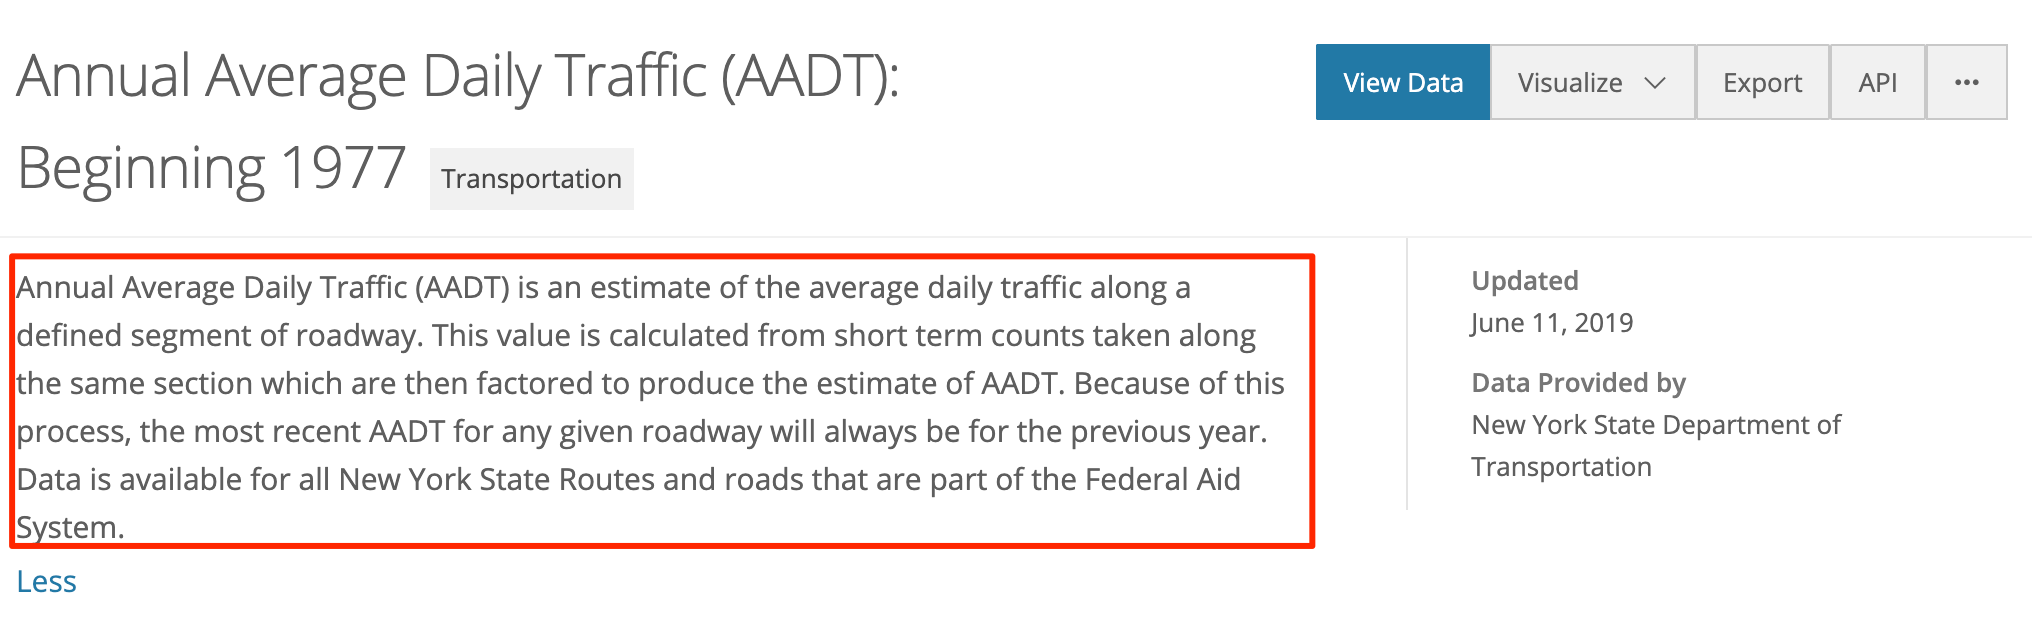
Let’s enter additional information so that users can better understand this data.
For the description of the data, enter the contents of the AADT.
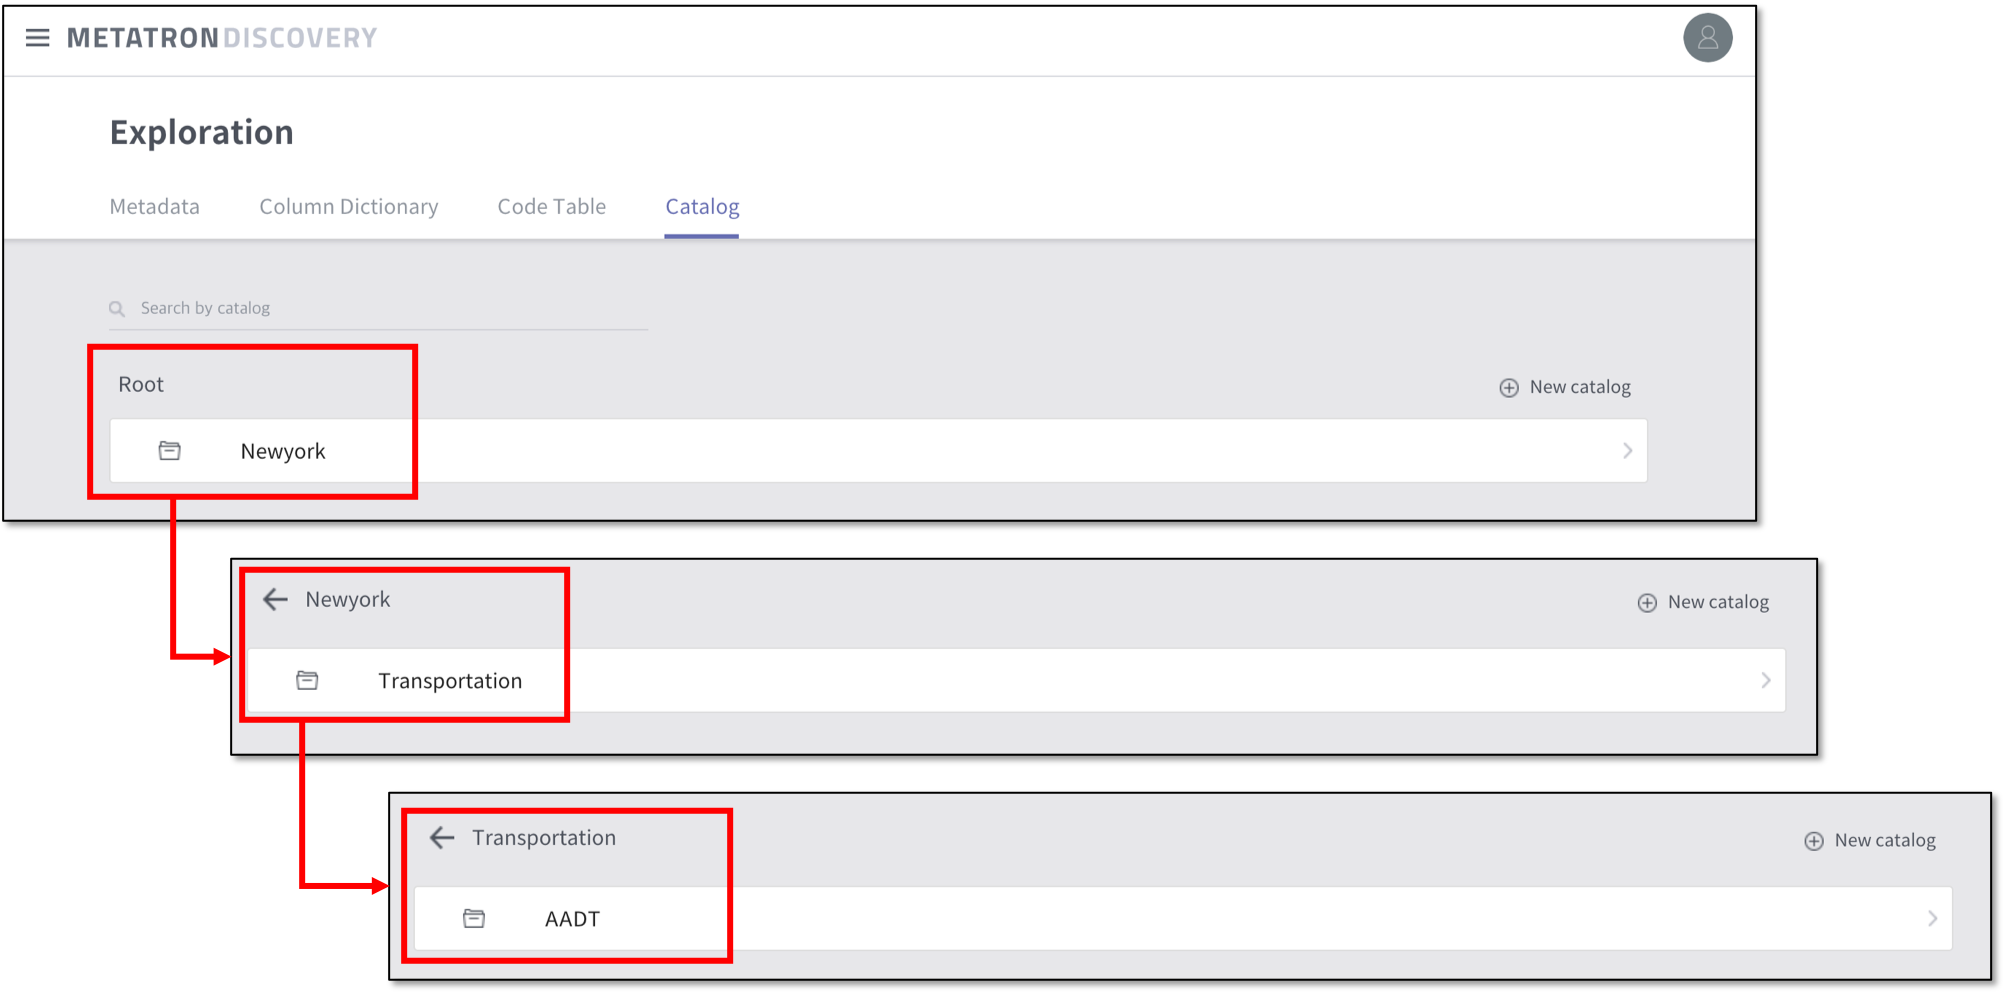
4. Metadata Classification
Add a Catalog so that users can easily find the data.
Create Newyork> Transportation> AADT catalog and assign it.
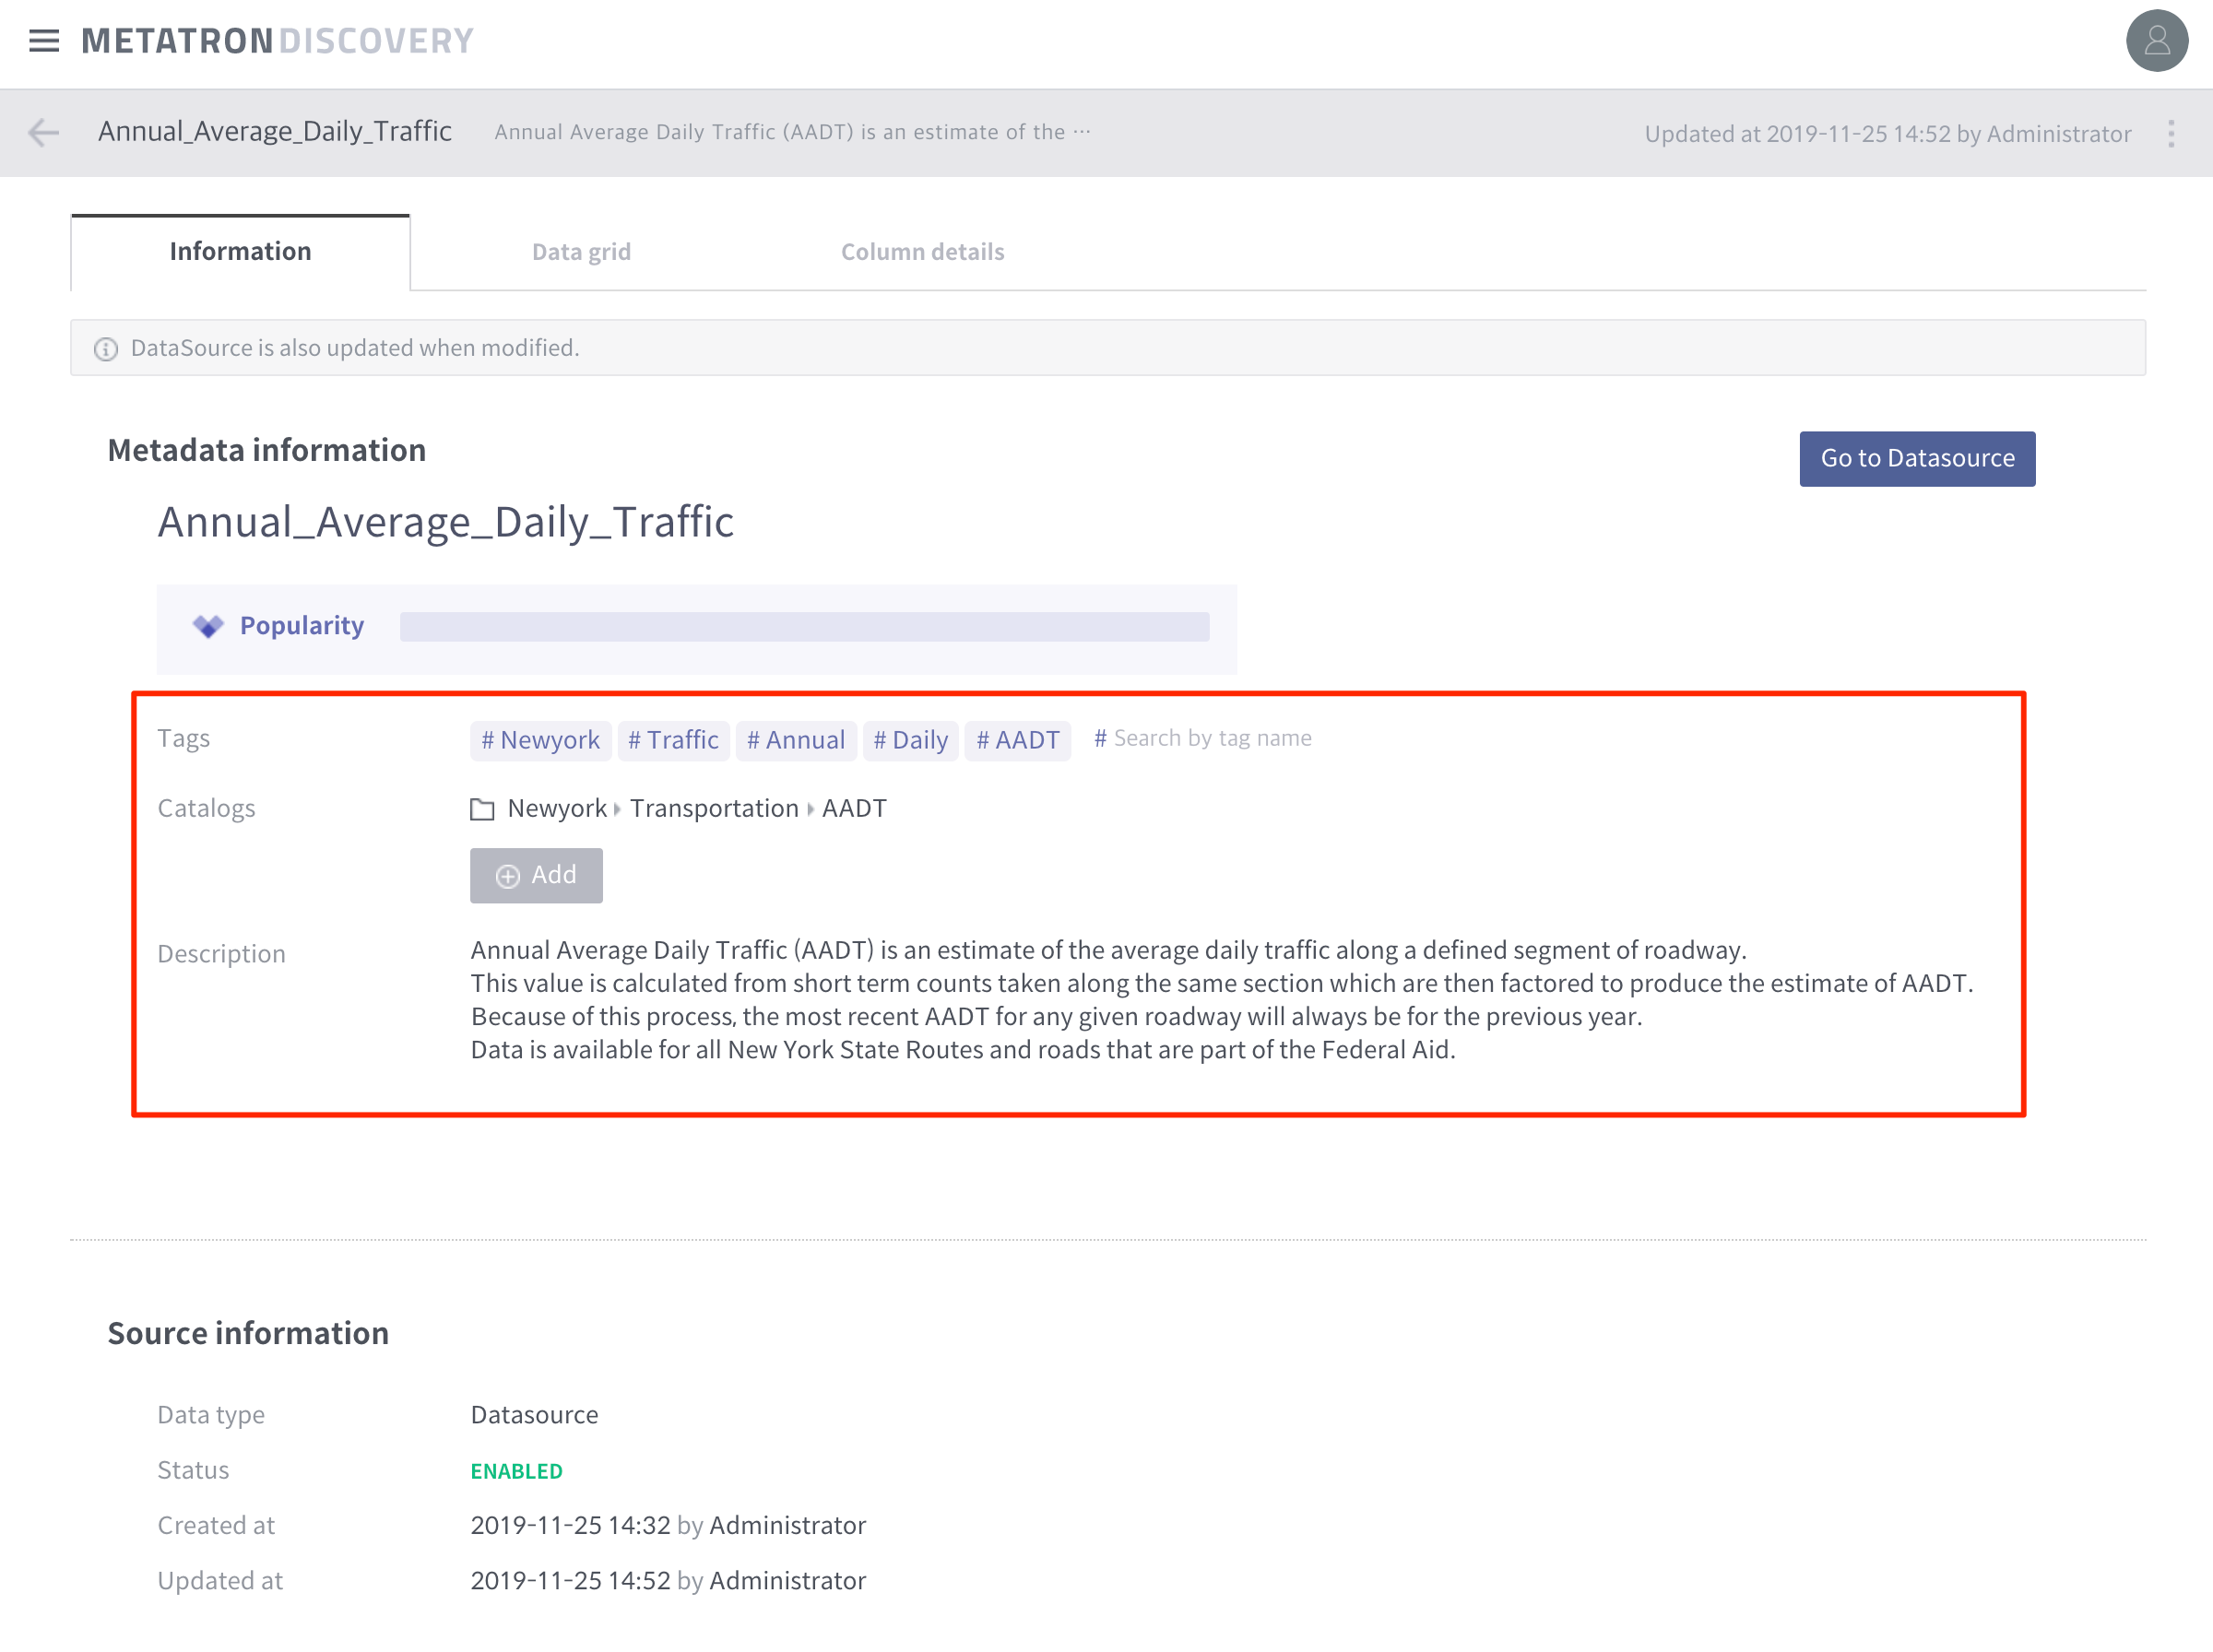
Enter Tag as Newyork, Traffic, Annual, Daily, AADT.
After entering the additional information, it looks like this:
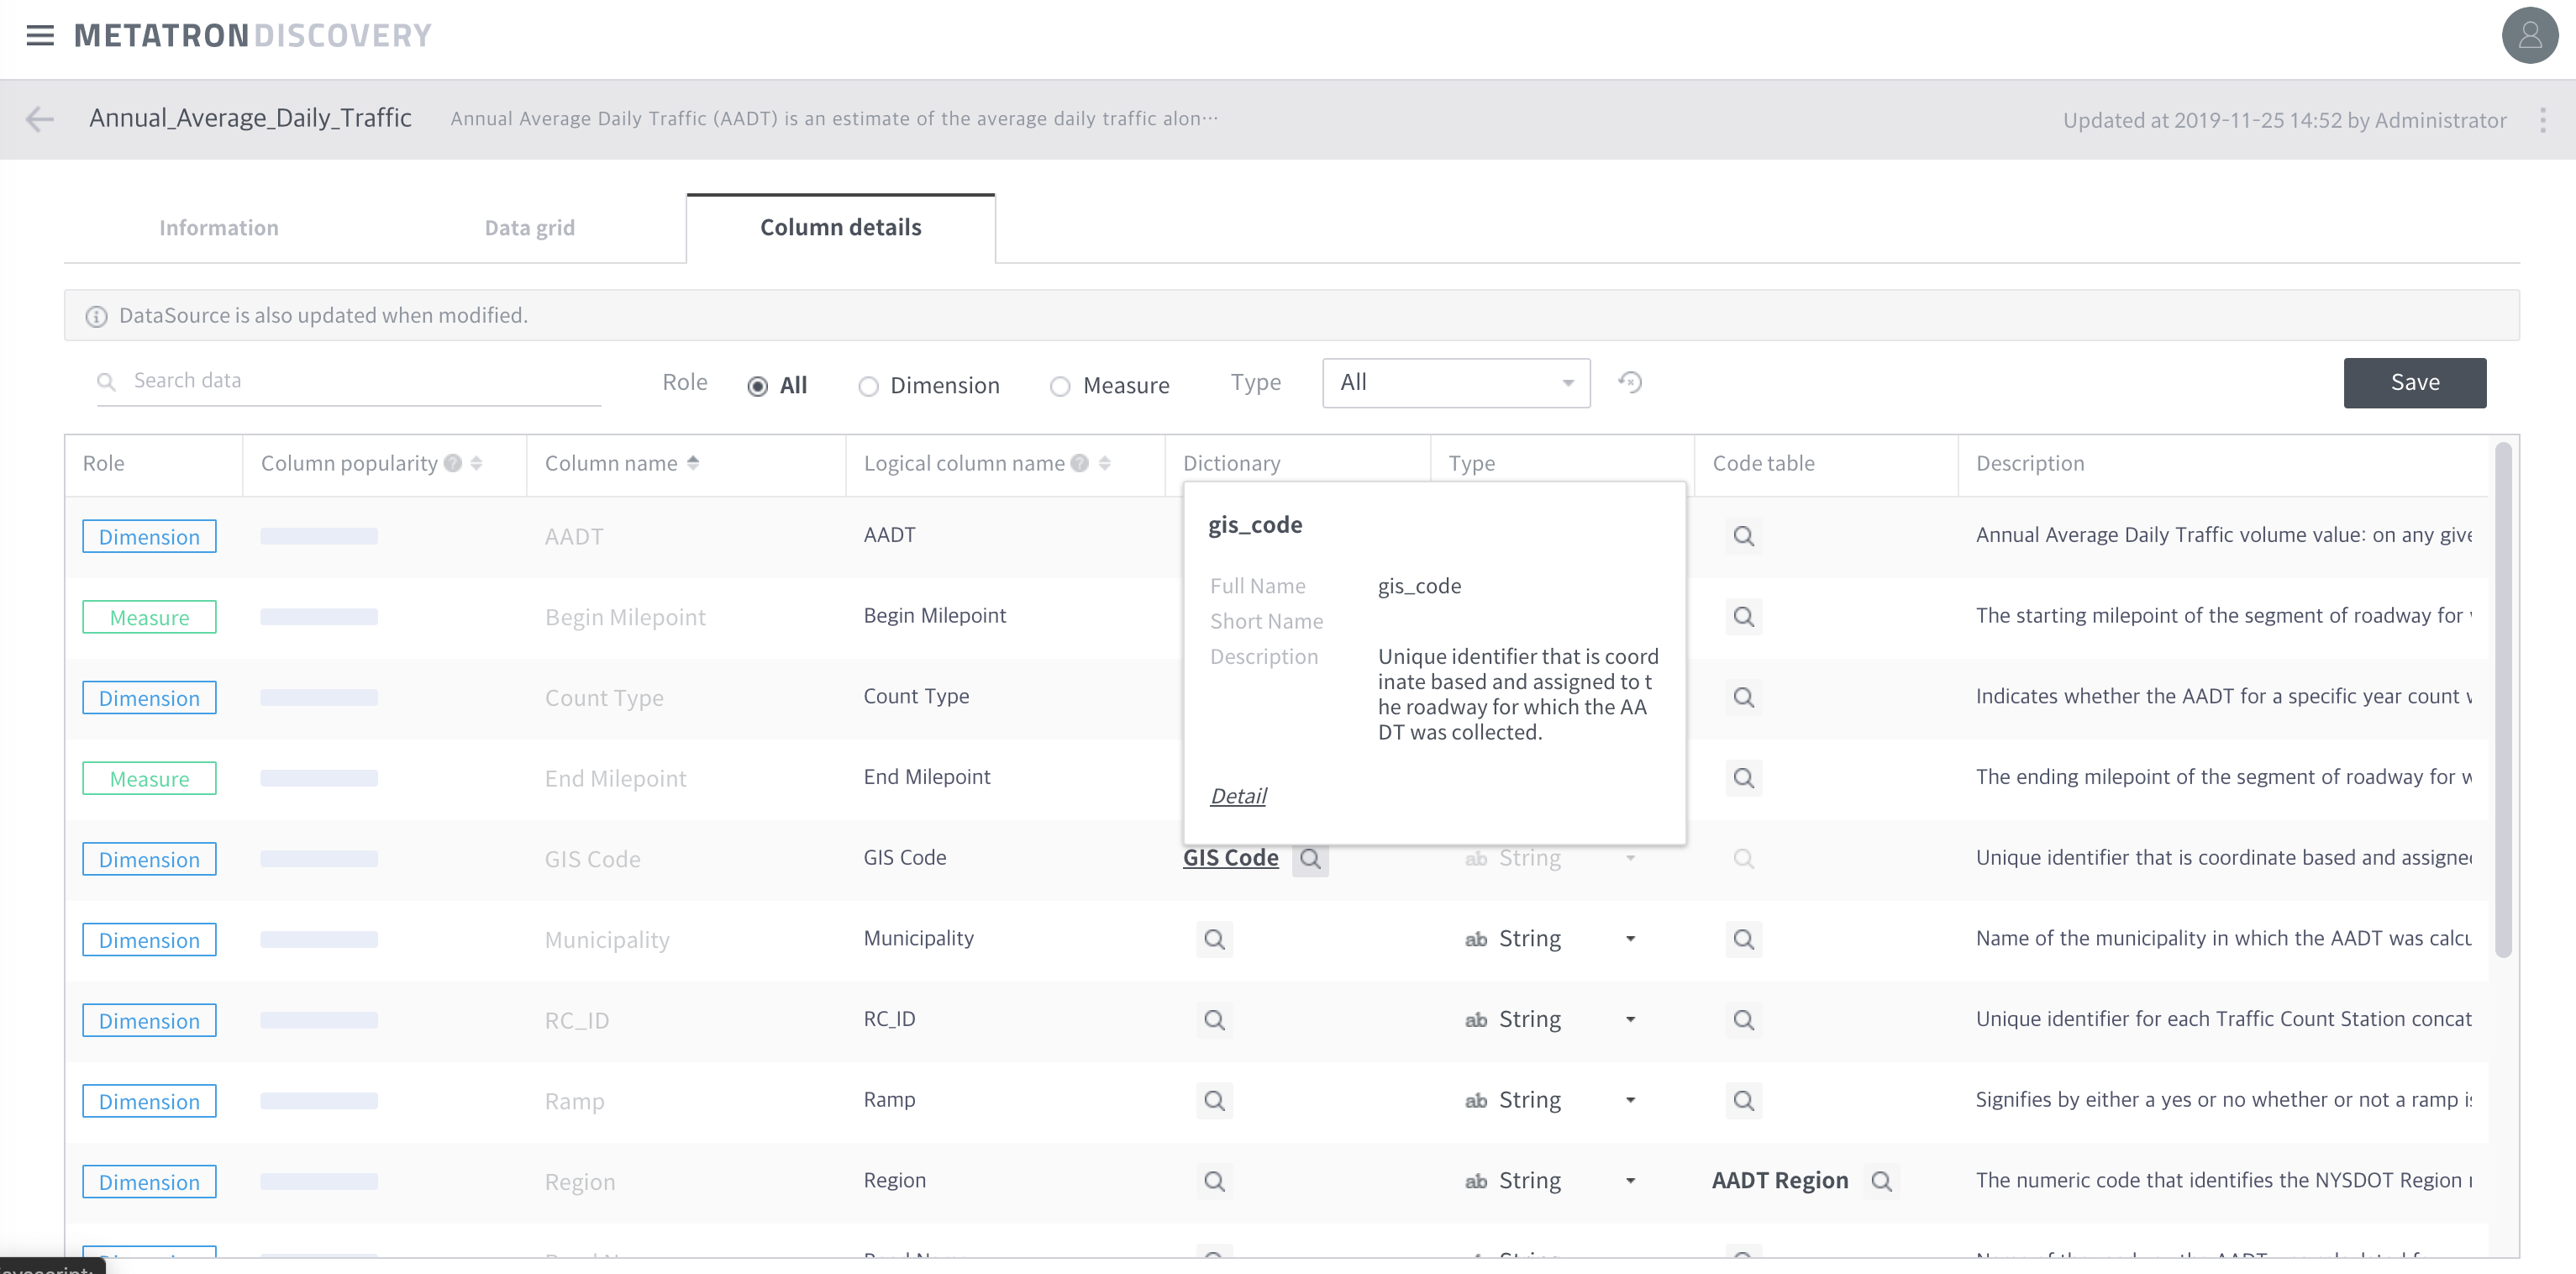
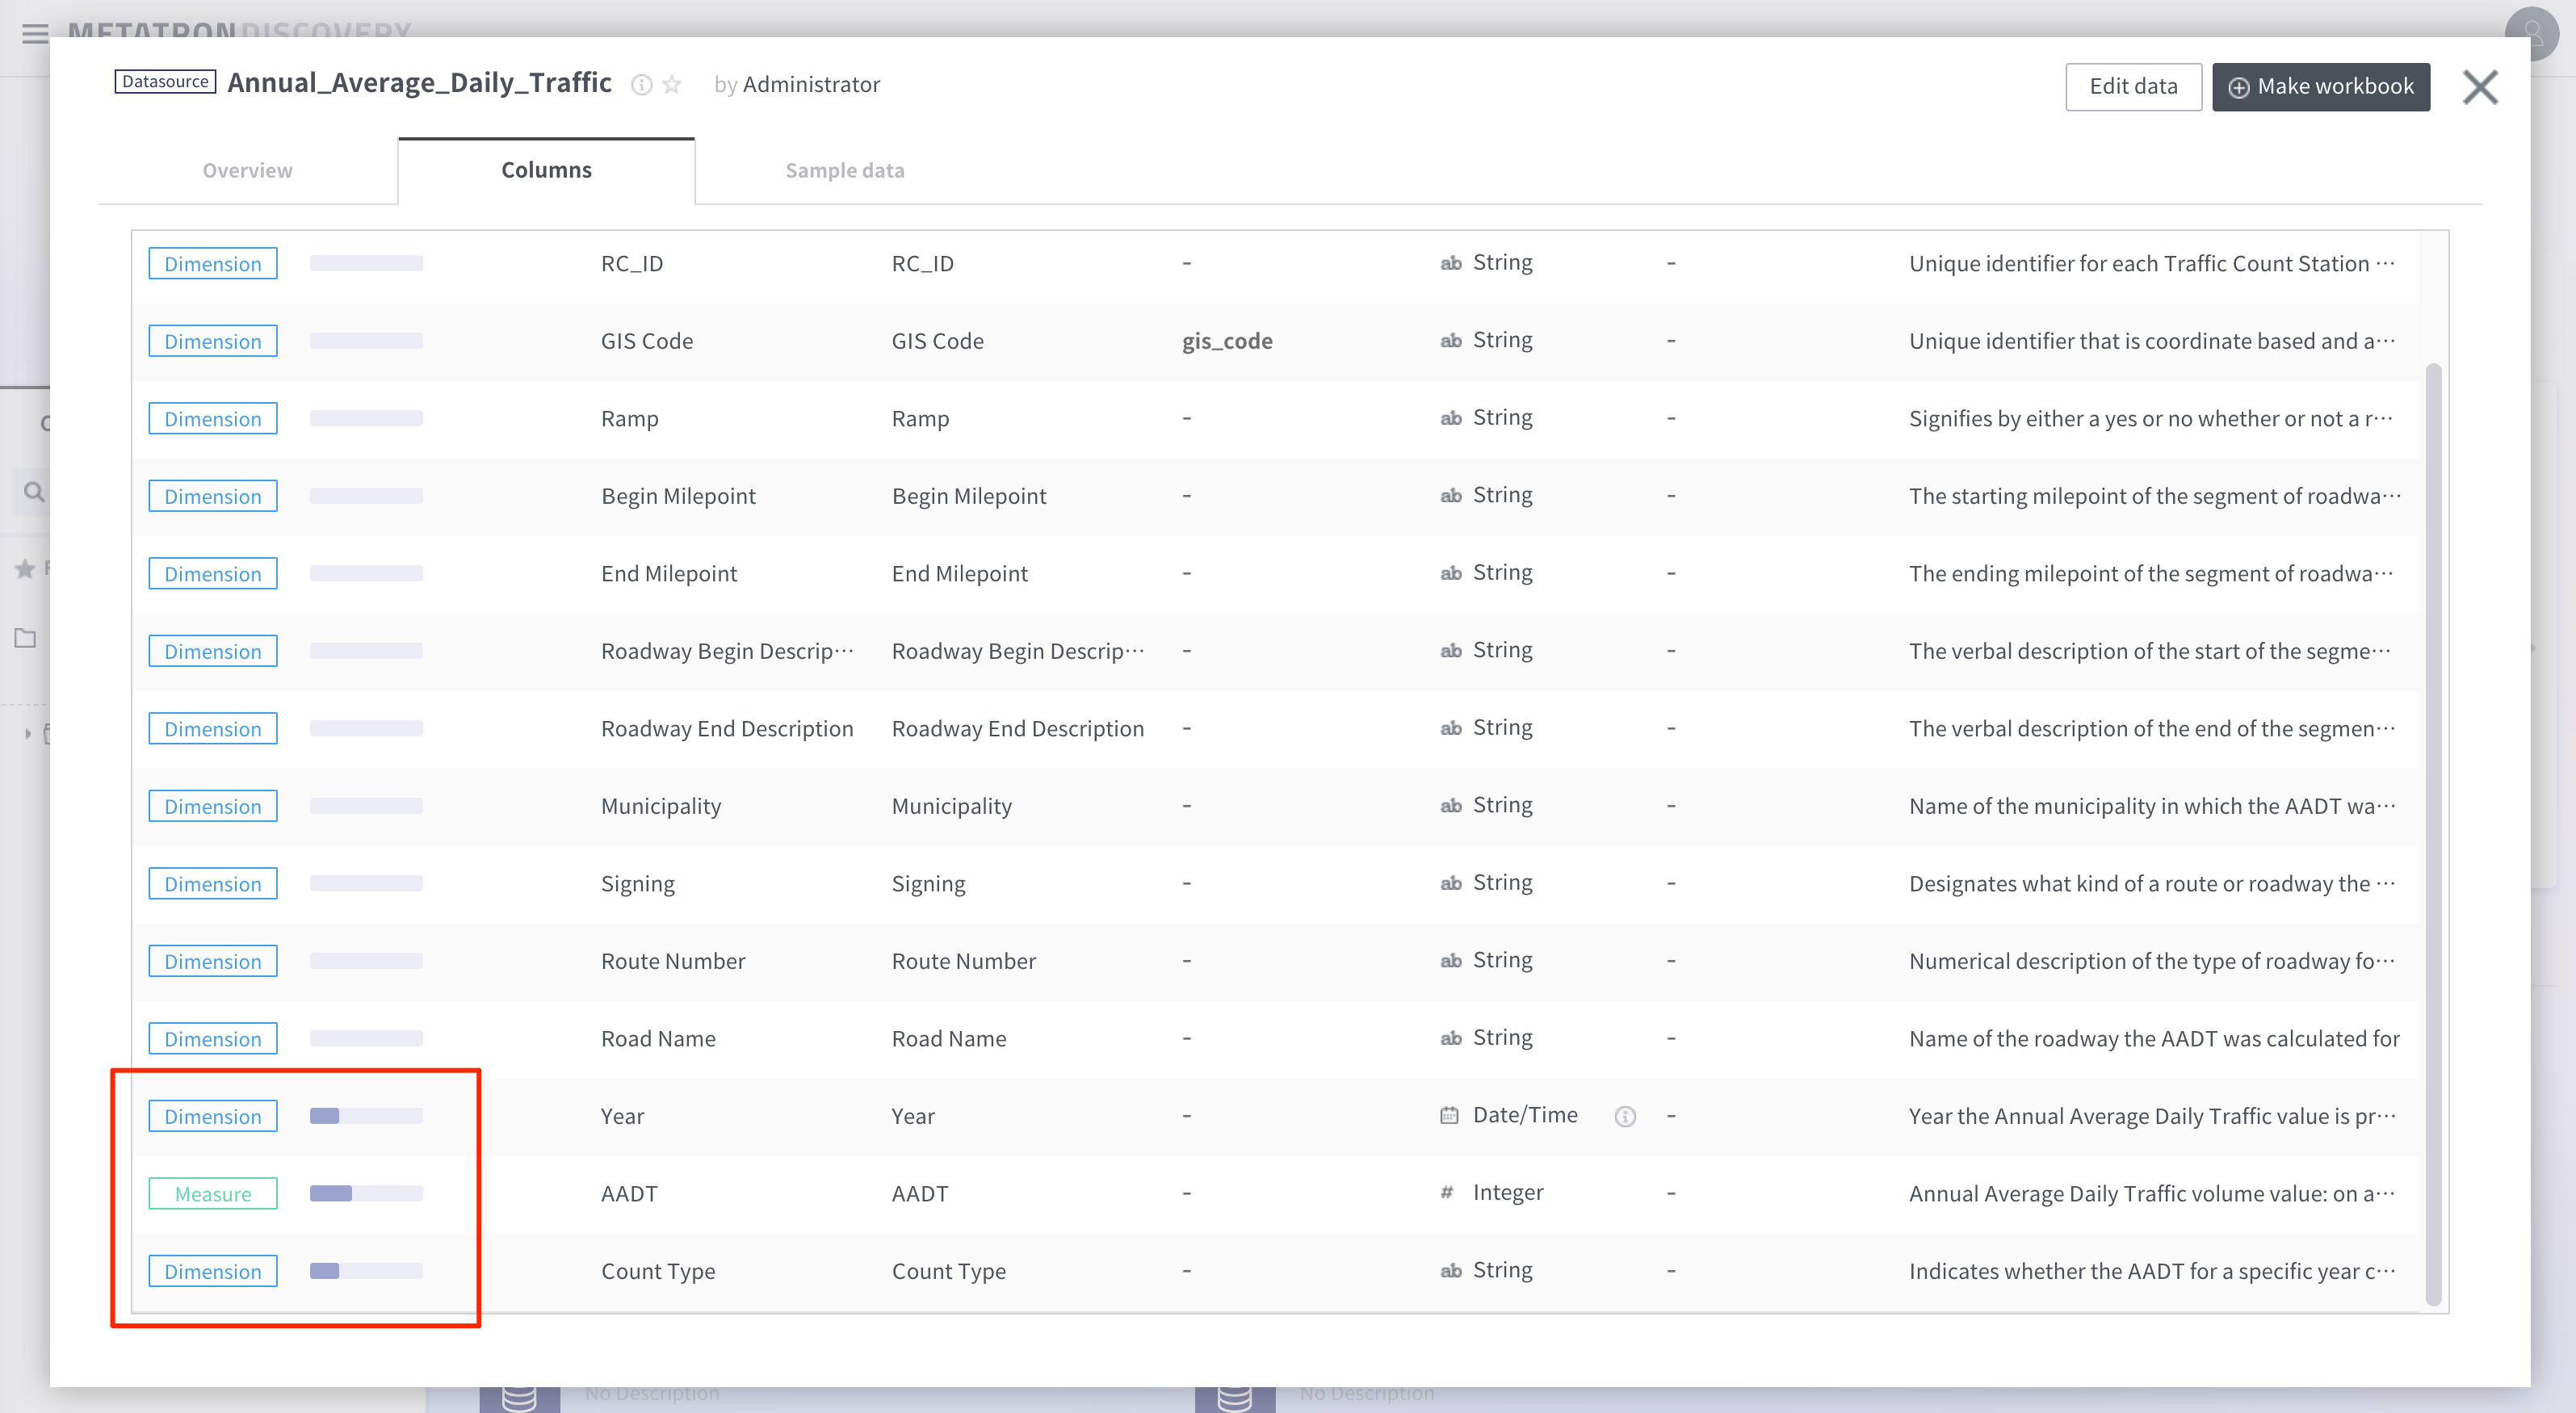
5. Column Curation
5-1. Columns Description
Enter as much detail as possible so you can provide accurate information.
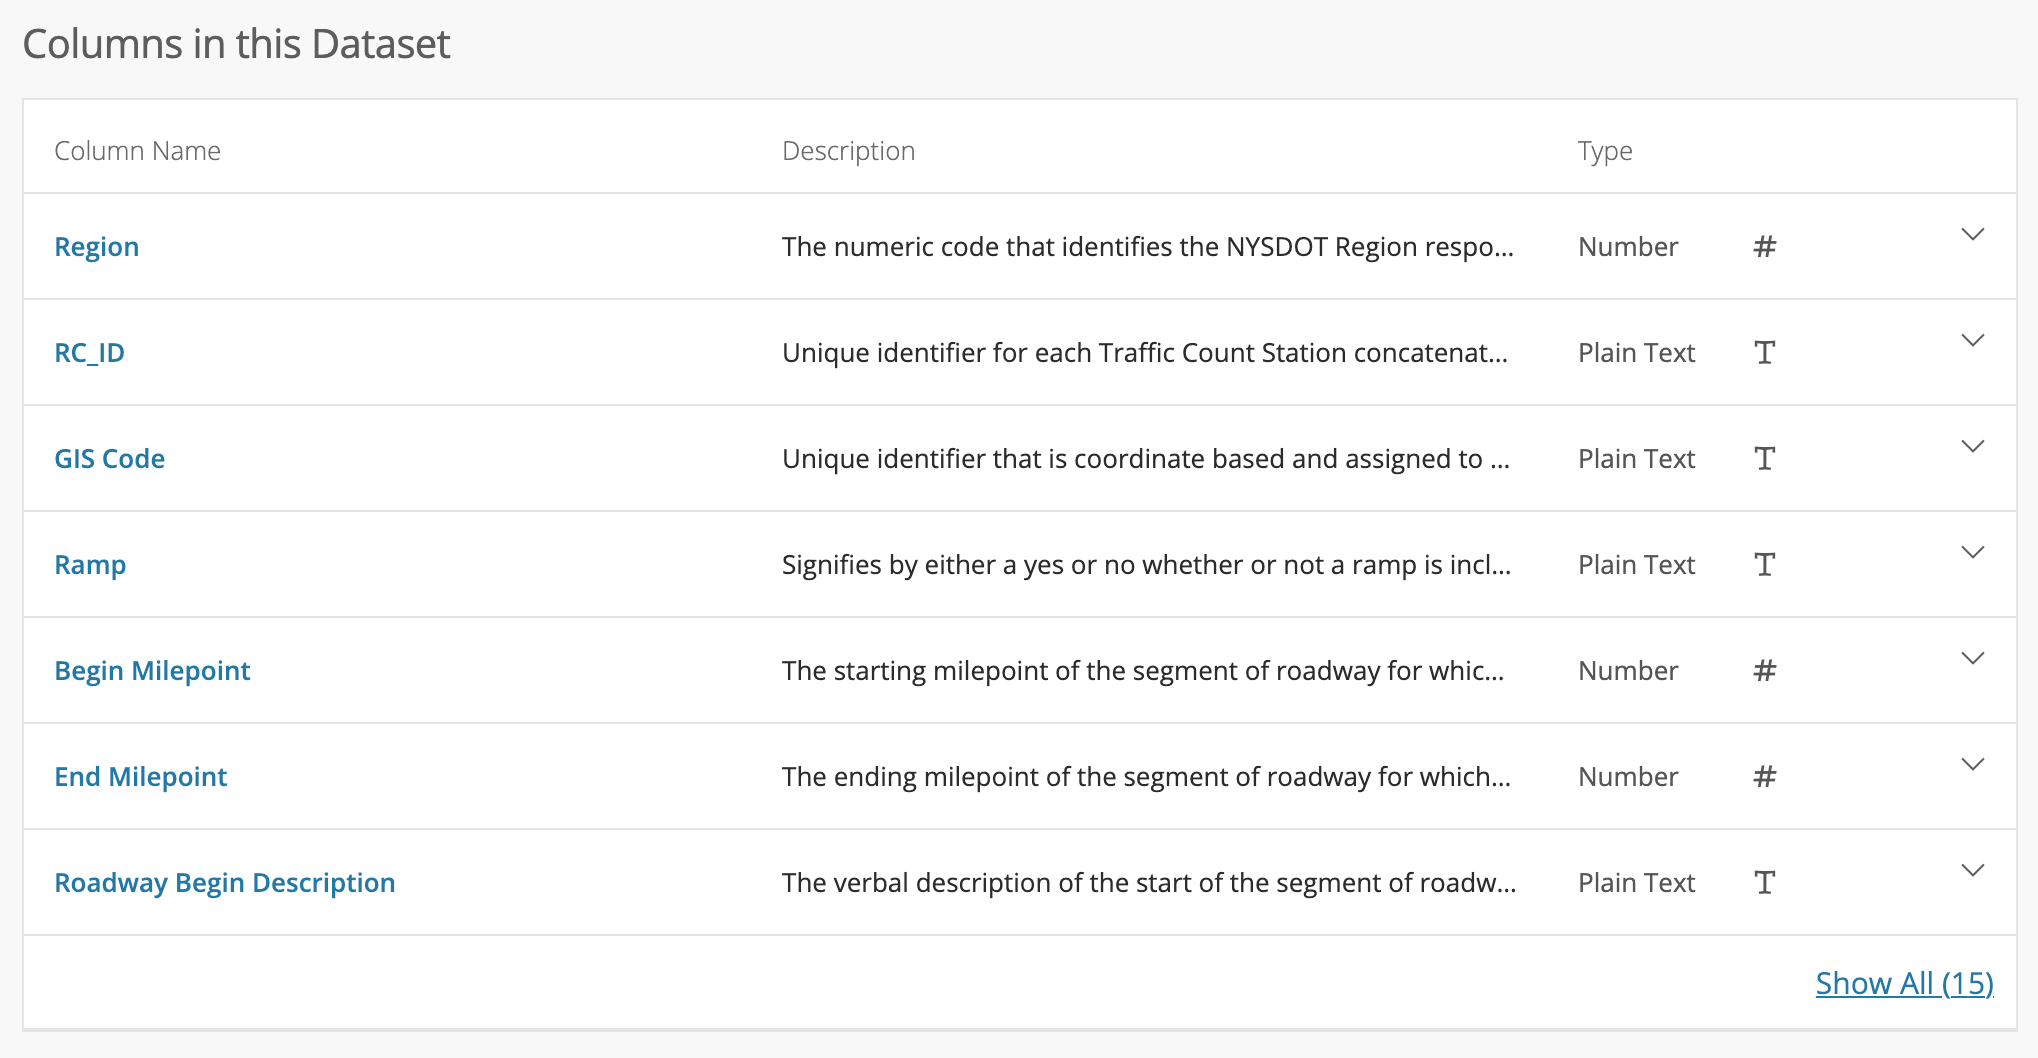
After entering the column description
5-2. Column Dictionary
You can define it as a Column Dictionary and map it to that column so that users can better understand the column later.
The column dictionary can be used in multiple tables to indicate whether or not a different physical column has the same meaning.
Column(GIS Code)
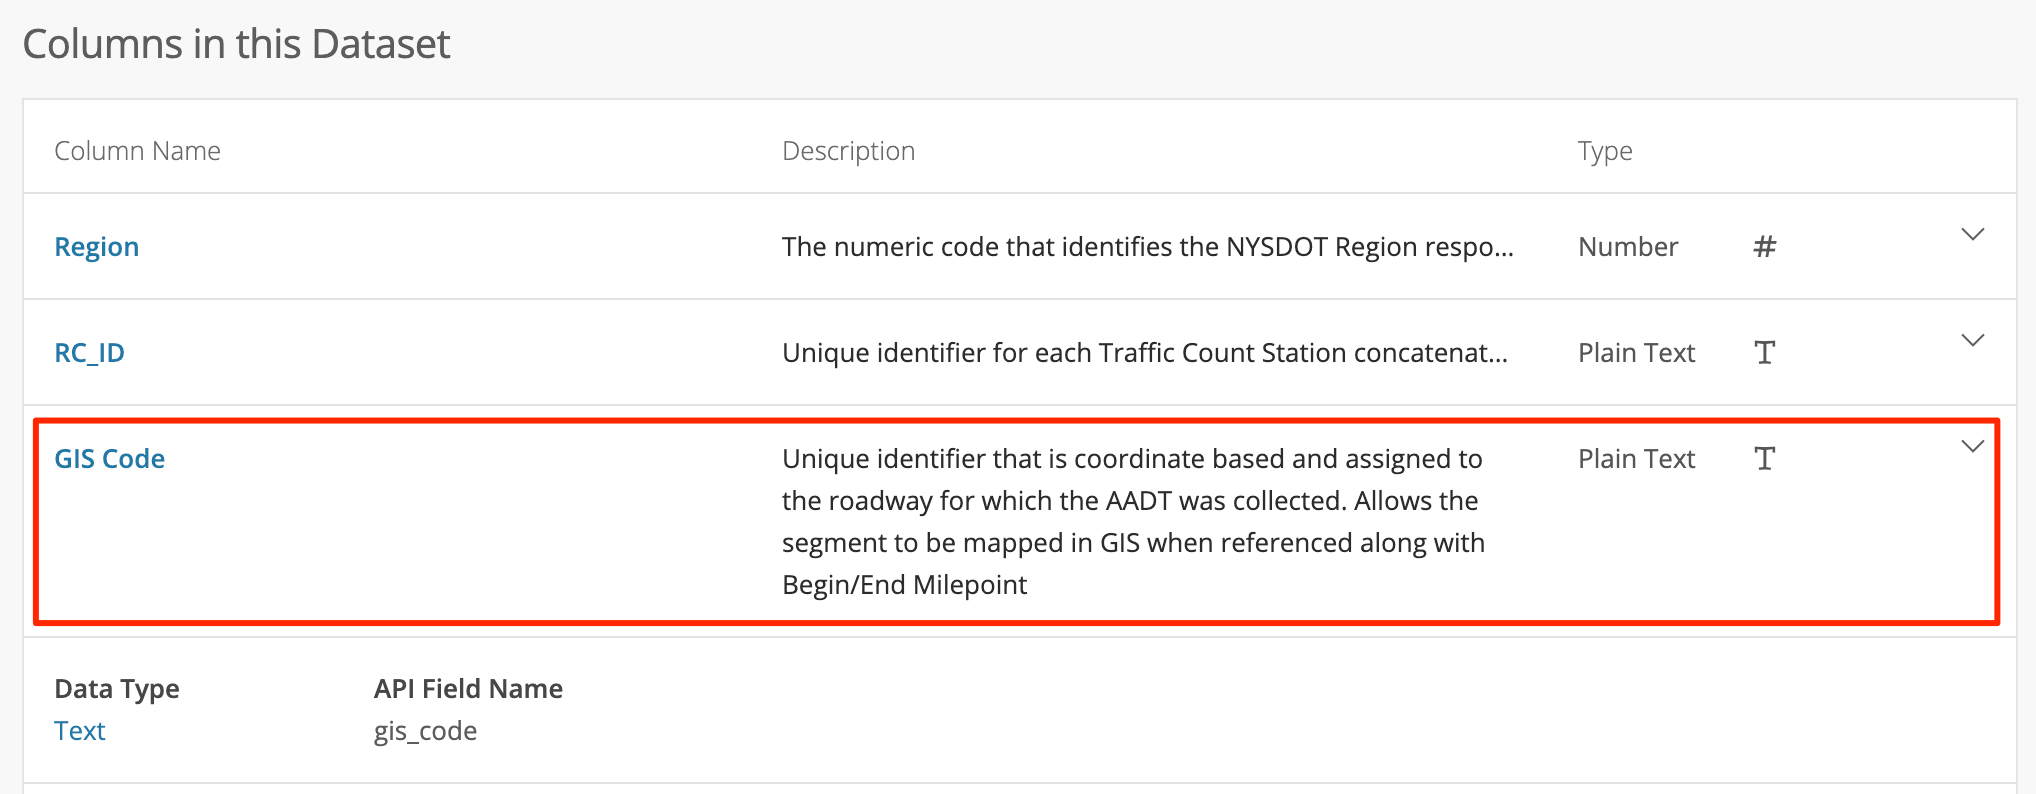
Description of GIS Code
Then create the Column Dictionary and map it in the Columns tab.
Create Column Dictionary
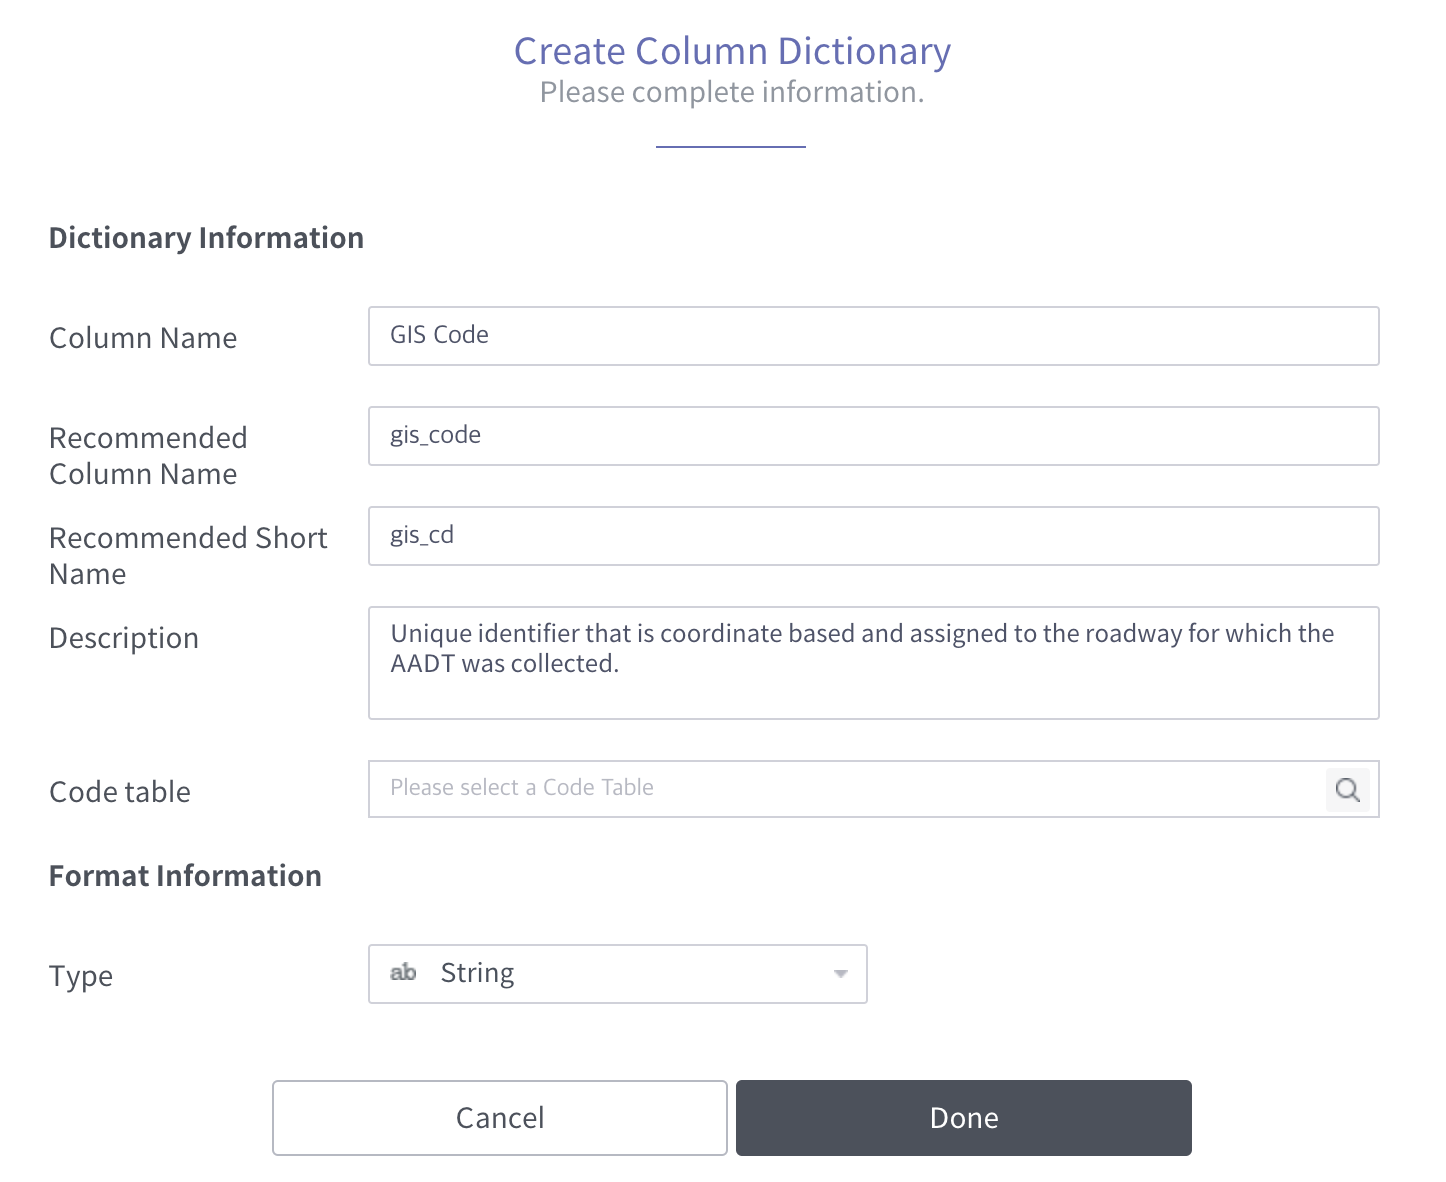
Create Column Dictionary
Mapping Column Dictionary
Mapping Column Dictionary
5-3. Code Table
The Region column has a value from 1 to 11, with the region each code represents.
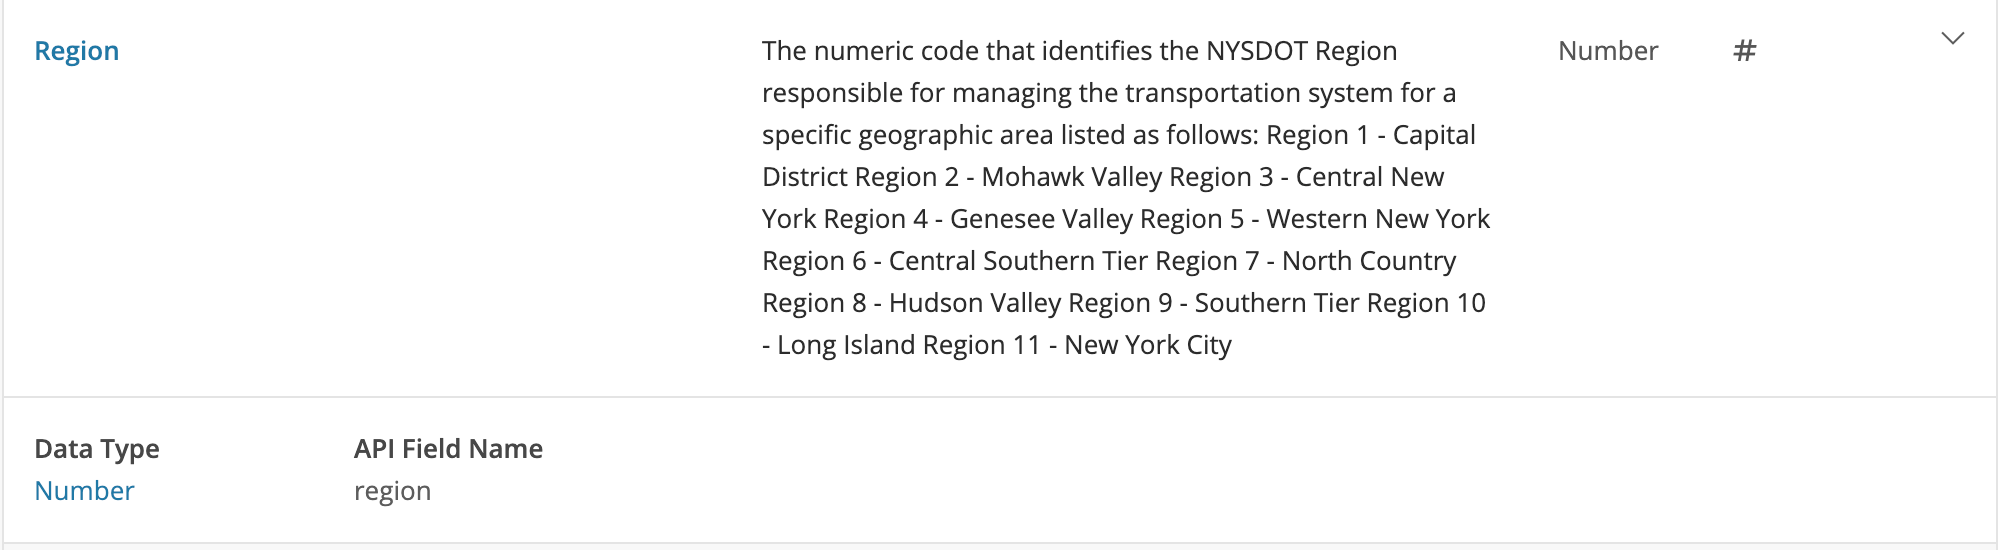
Description of Region
Region 1 - Capital District
Region 2 - Mohawk Valley
Region 3 - Central New York
Region 4 - Genesee Valley
Region 5 - Western New York
Region 6 - Central Southern Tier
Region 7 - North Country
Region 8 - Hudson Valley
Region 9 - Southern Tier
Region 10 - Long Island
Region 11 - New York City
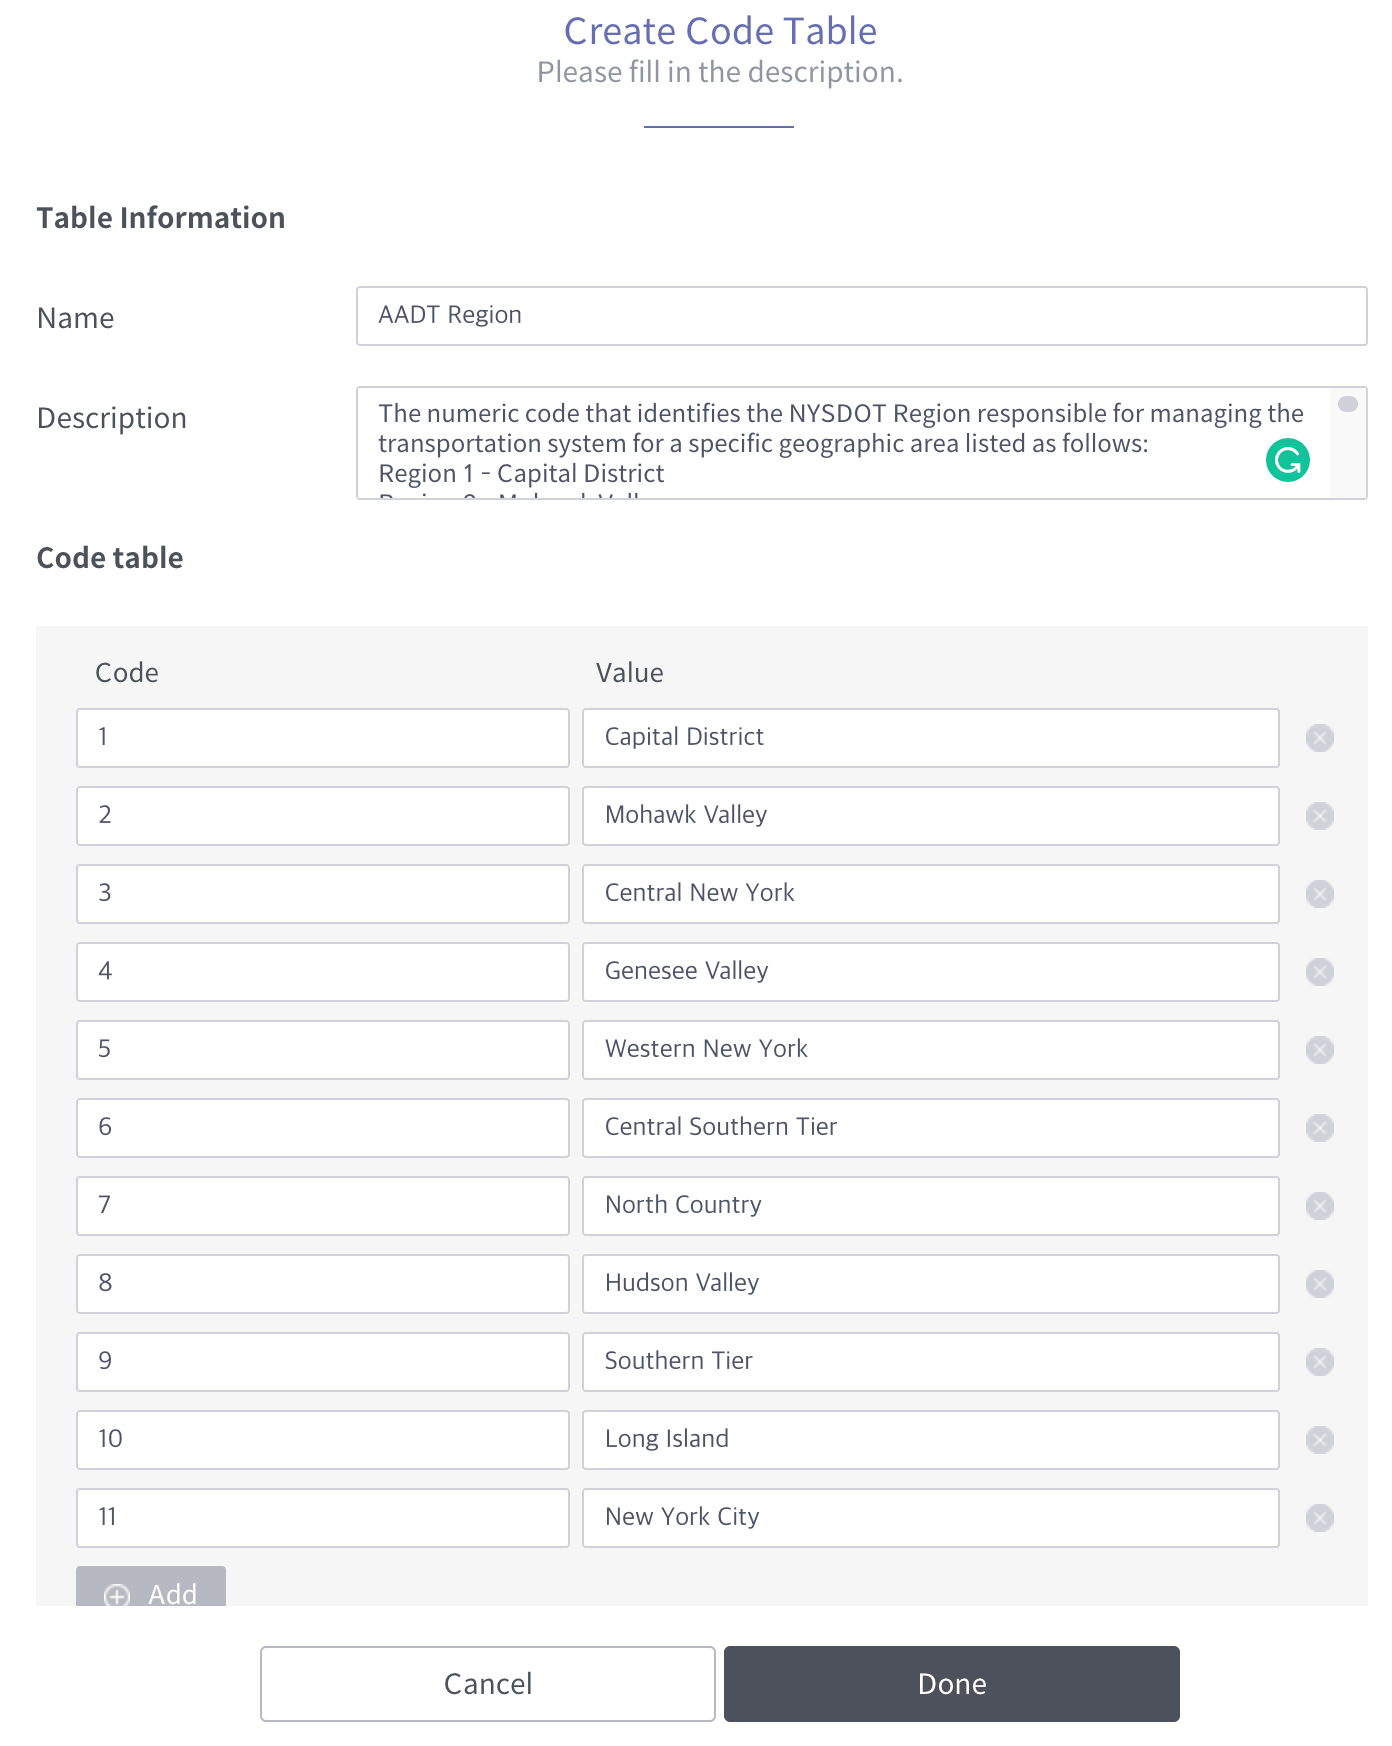
Create Code Table
Assign Code Table to column

In this way, we saw the process of creating NY Traffic data and curating it to explain the data well.
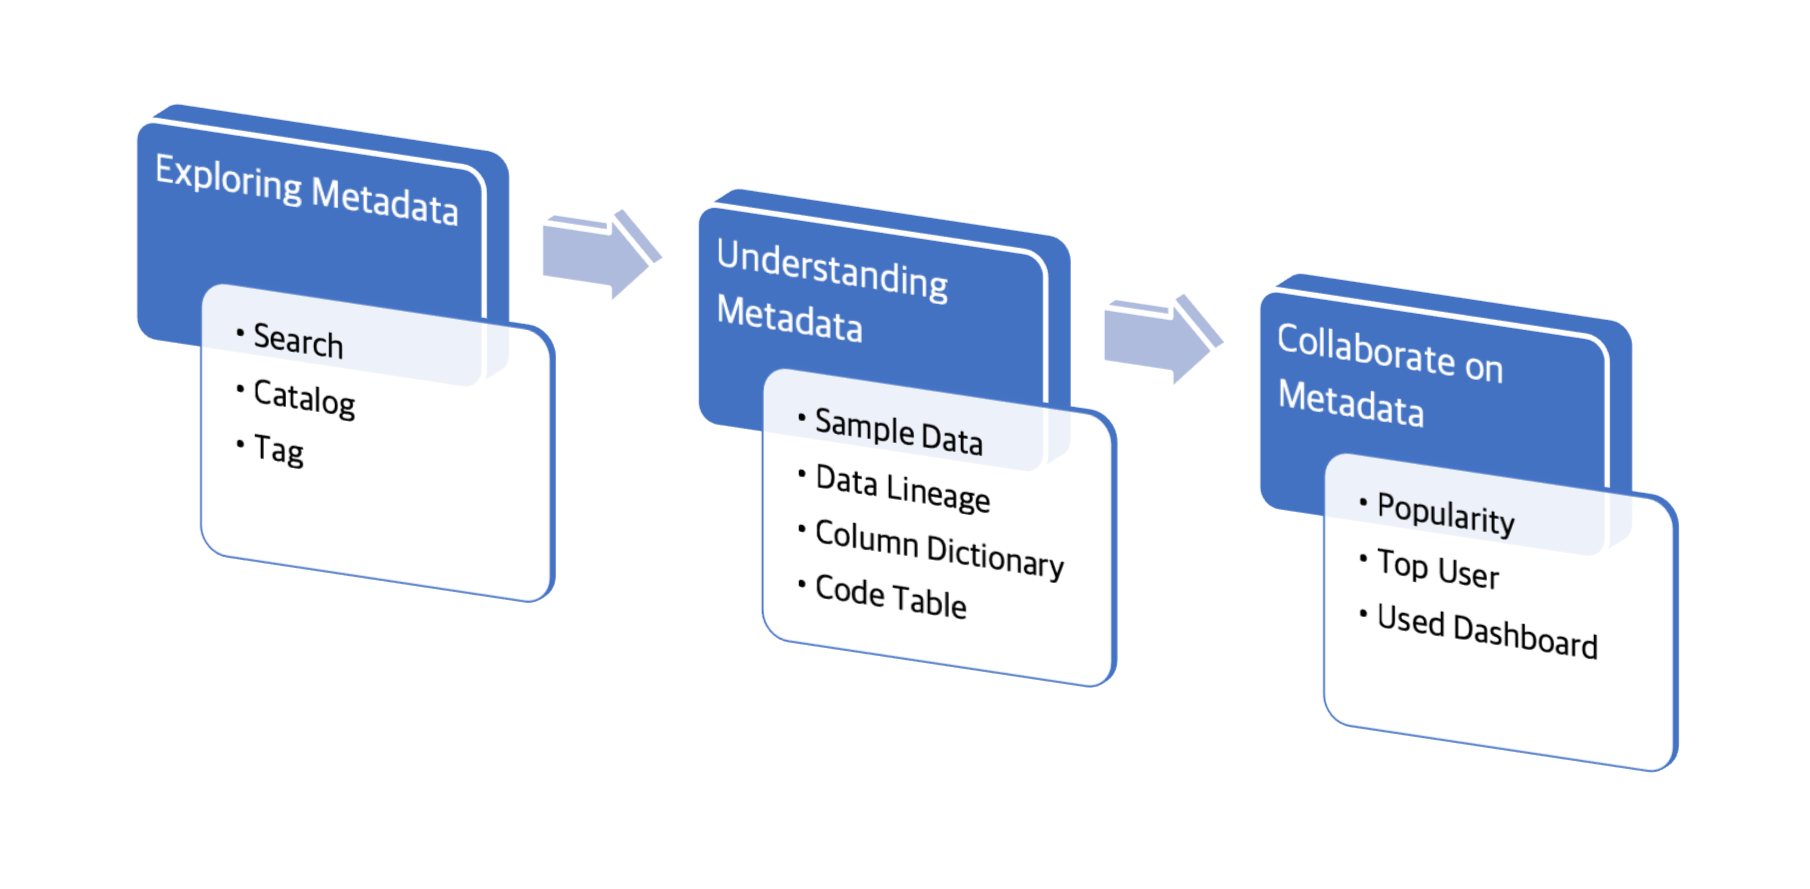
Let’s take a look at the process of finding, understanding, and using the created metadata.Data Consumer
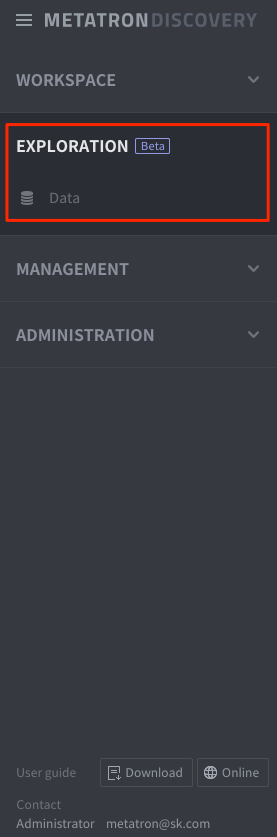
1. Exploring Metadata
When you enter the Exploration screen for the first time, you can find the tags and catalogs on the left, and you can check the list of popularity and recent creation.
It can tell you which data is recently registered and can tell you what data is used by many users.
The AADT data we just created is shown in the newly created list.
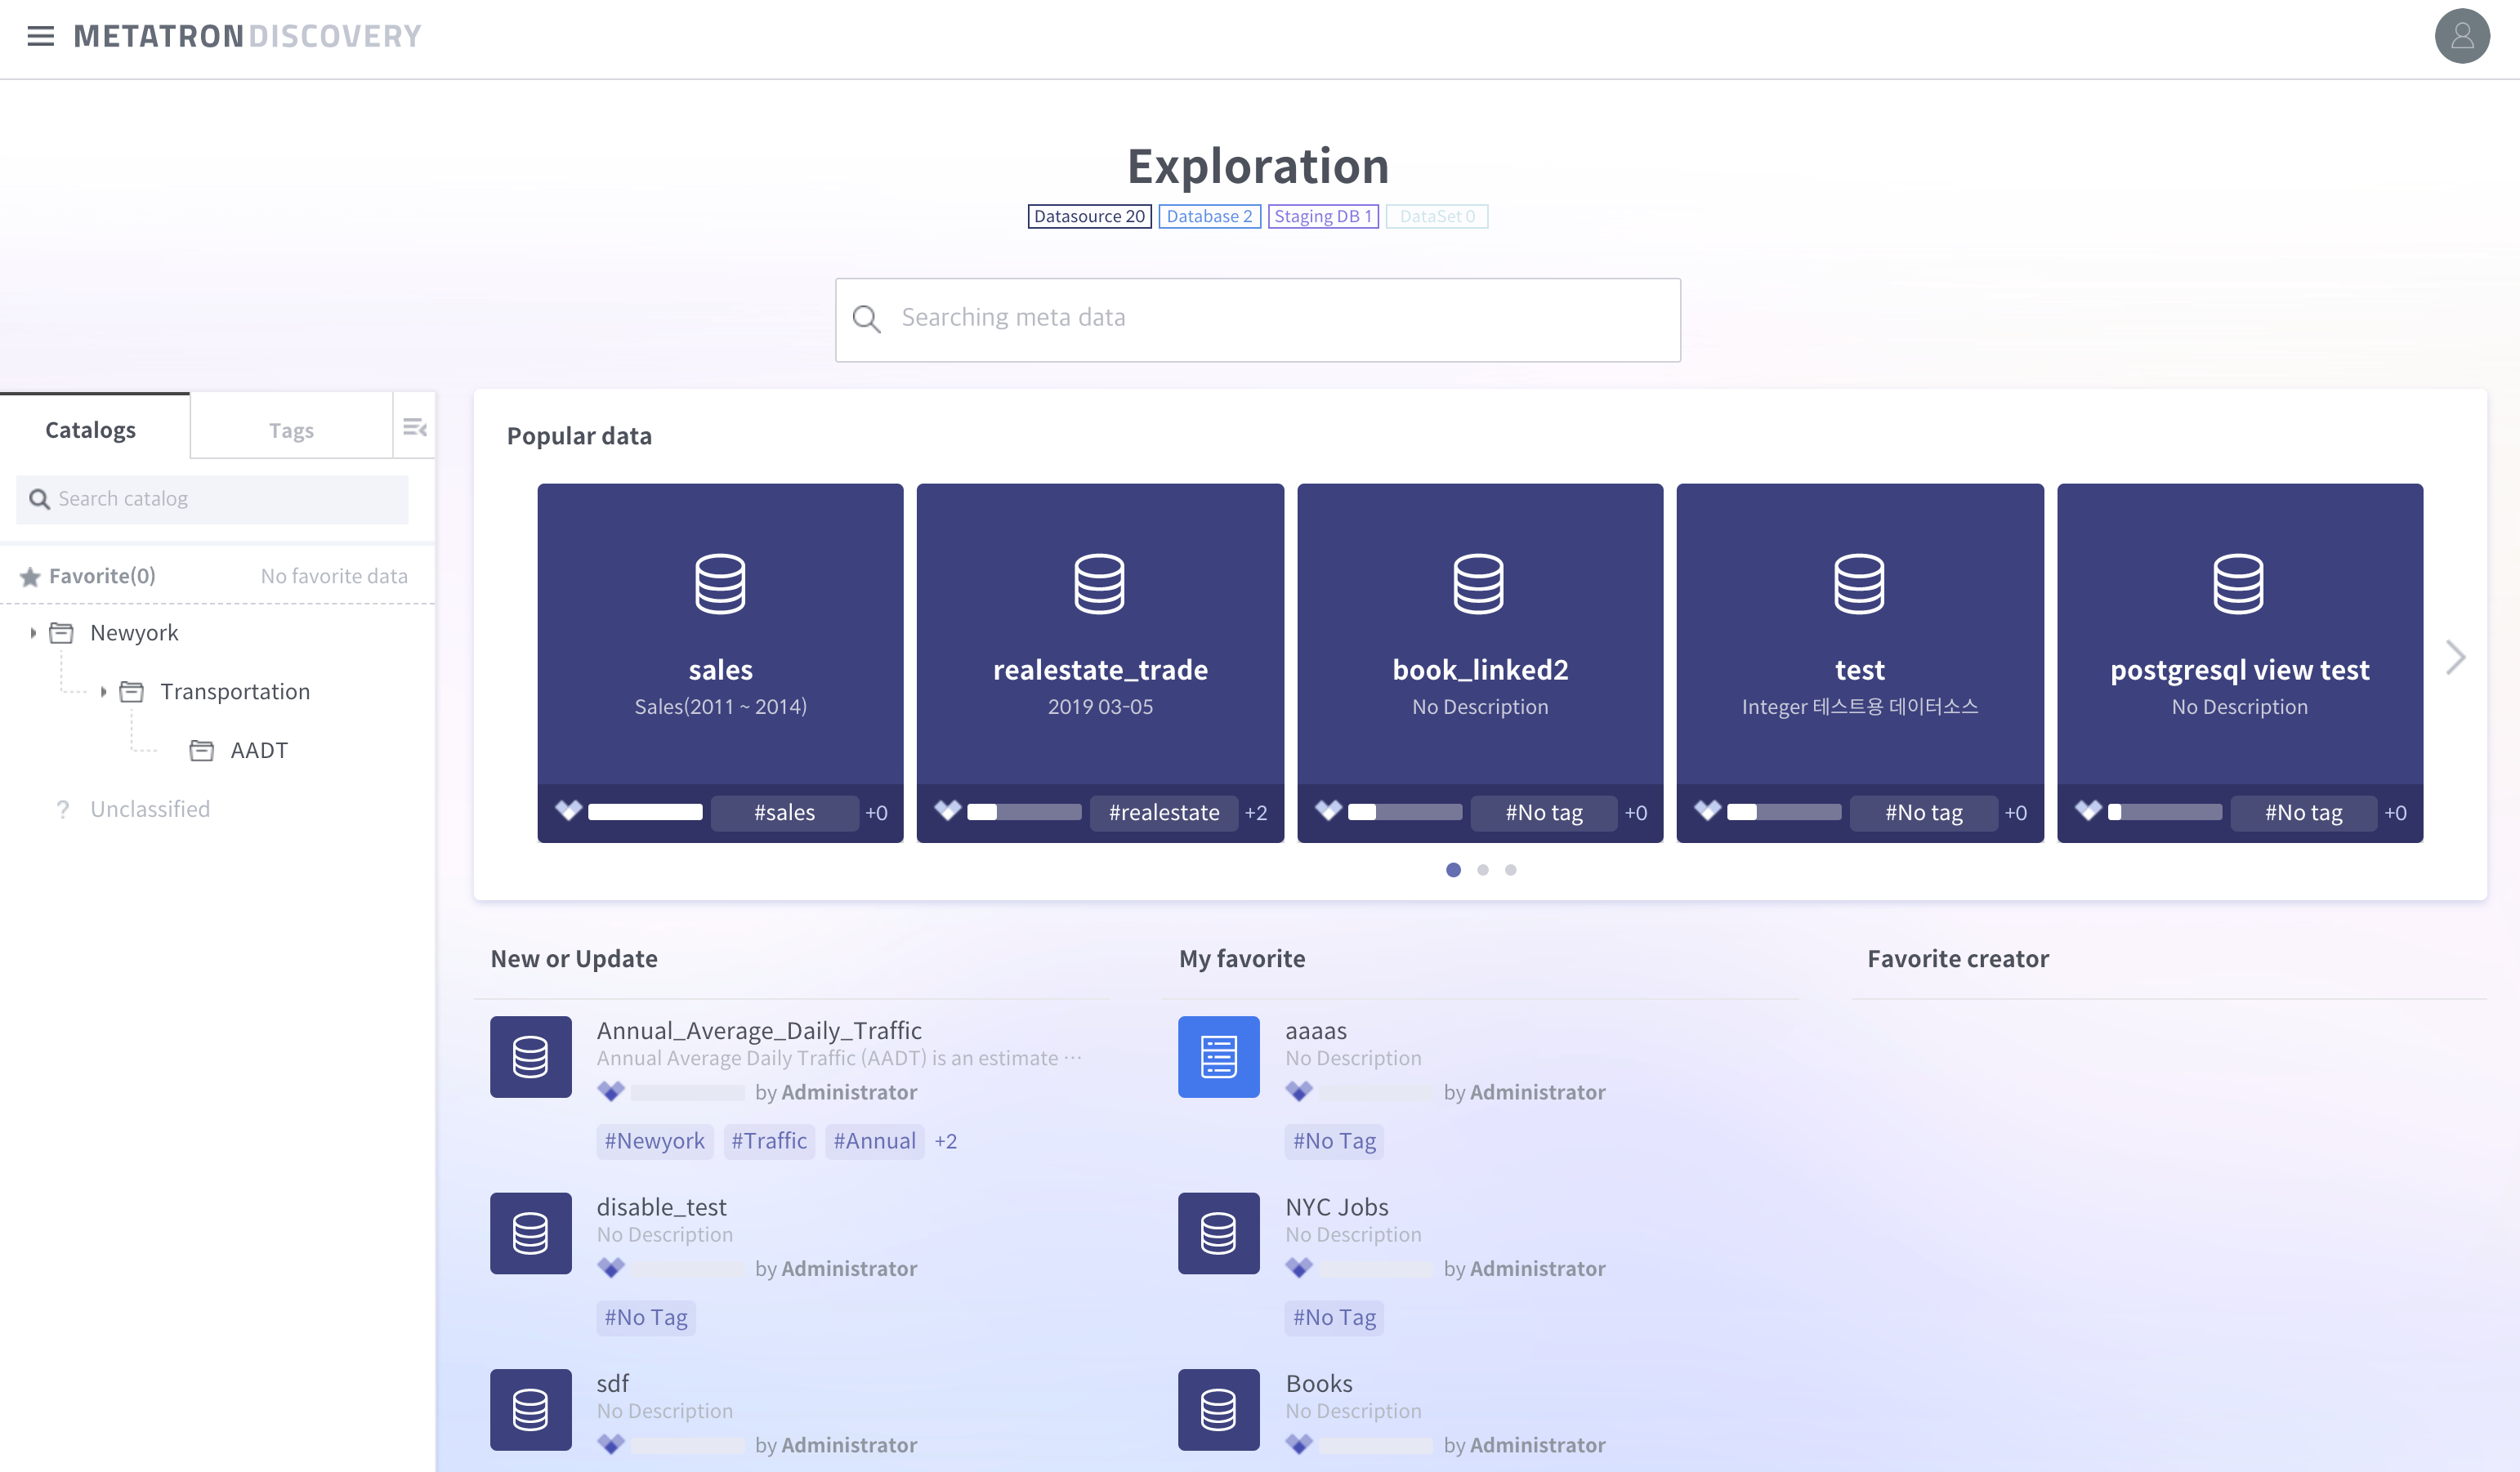
Exploration Metadata
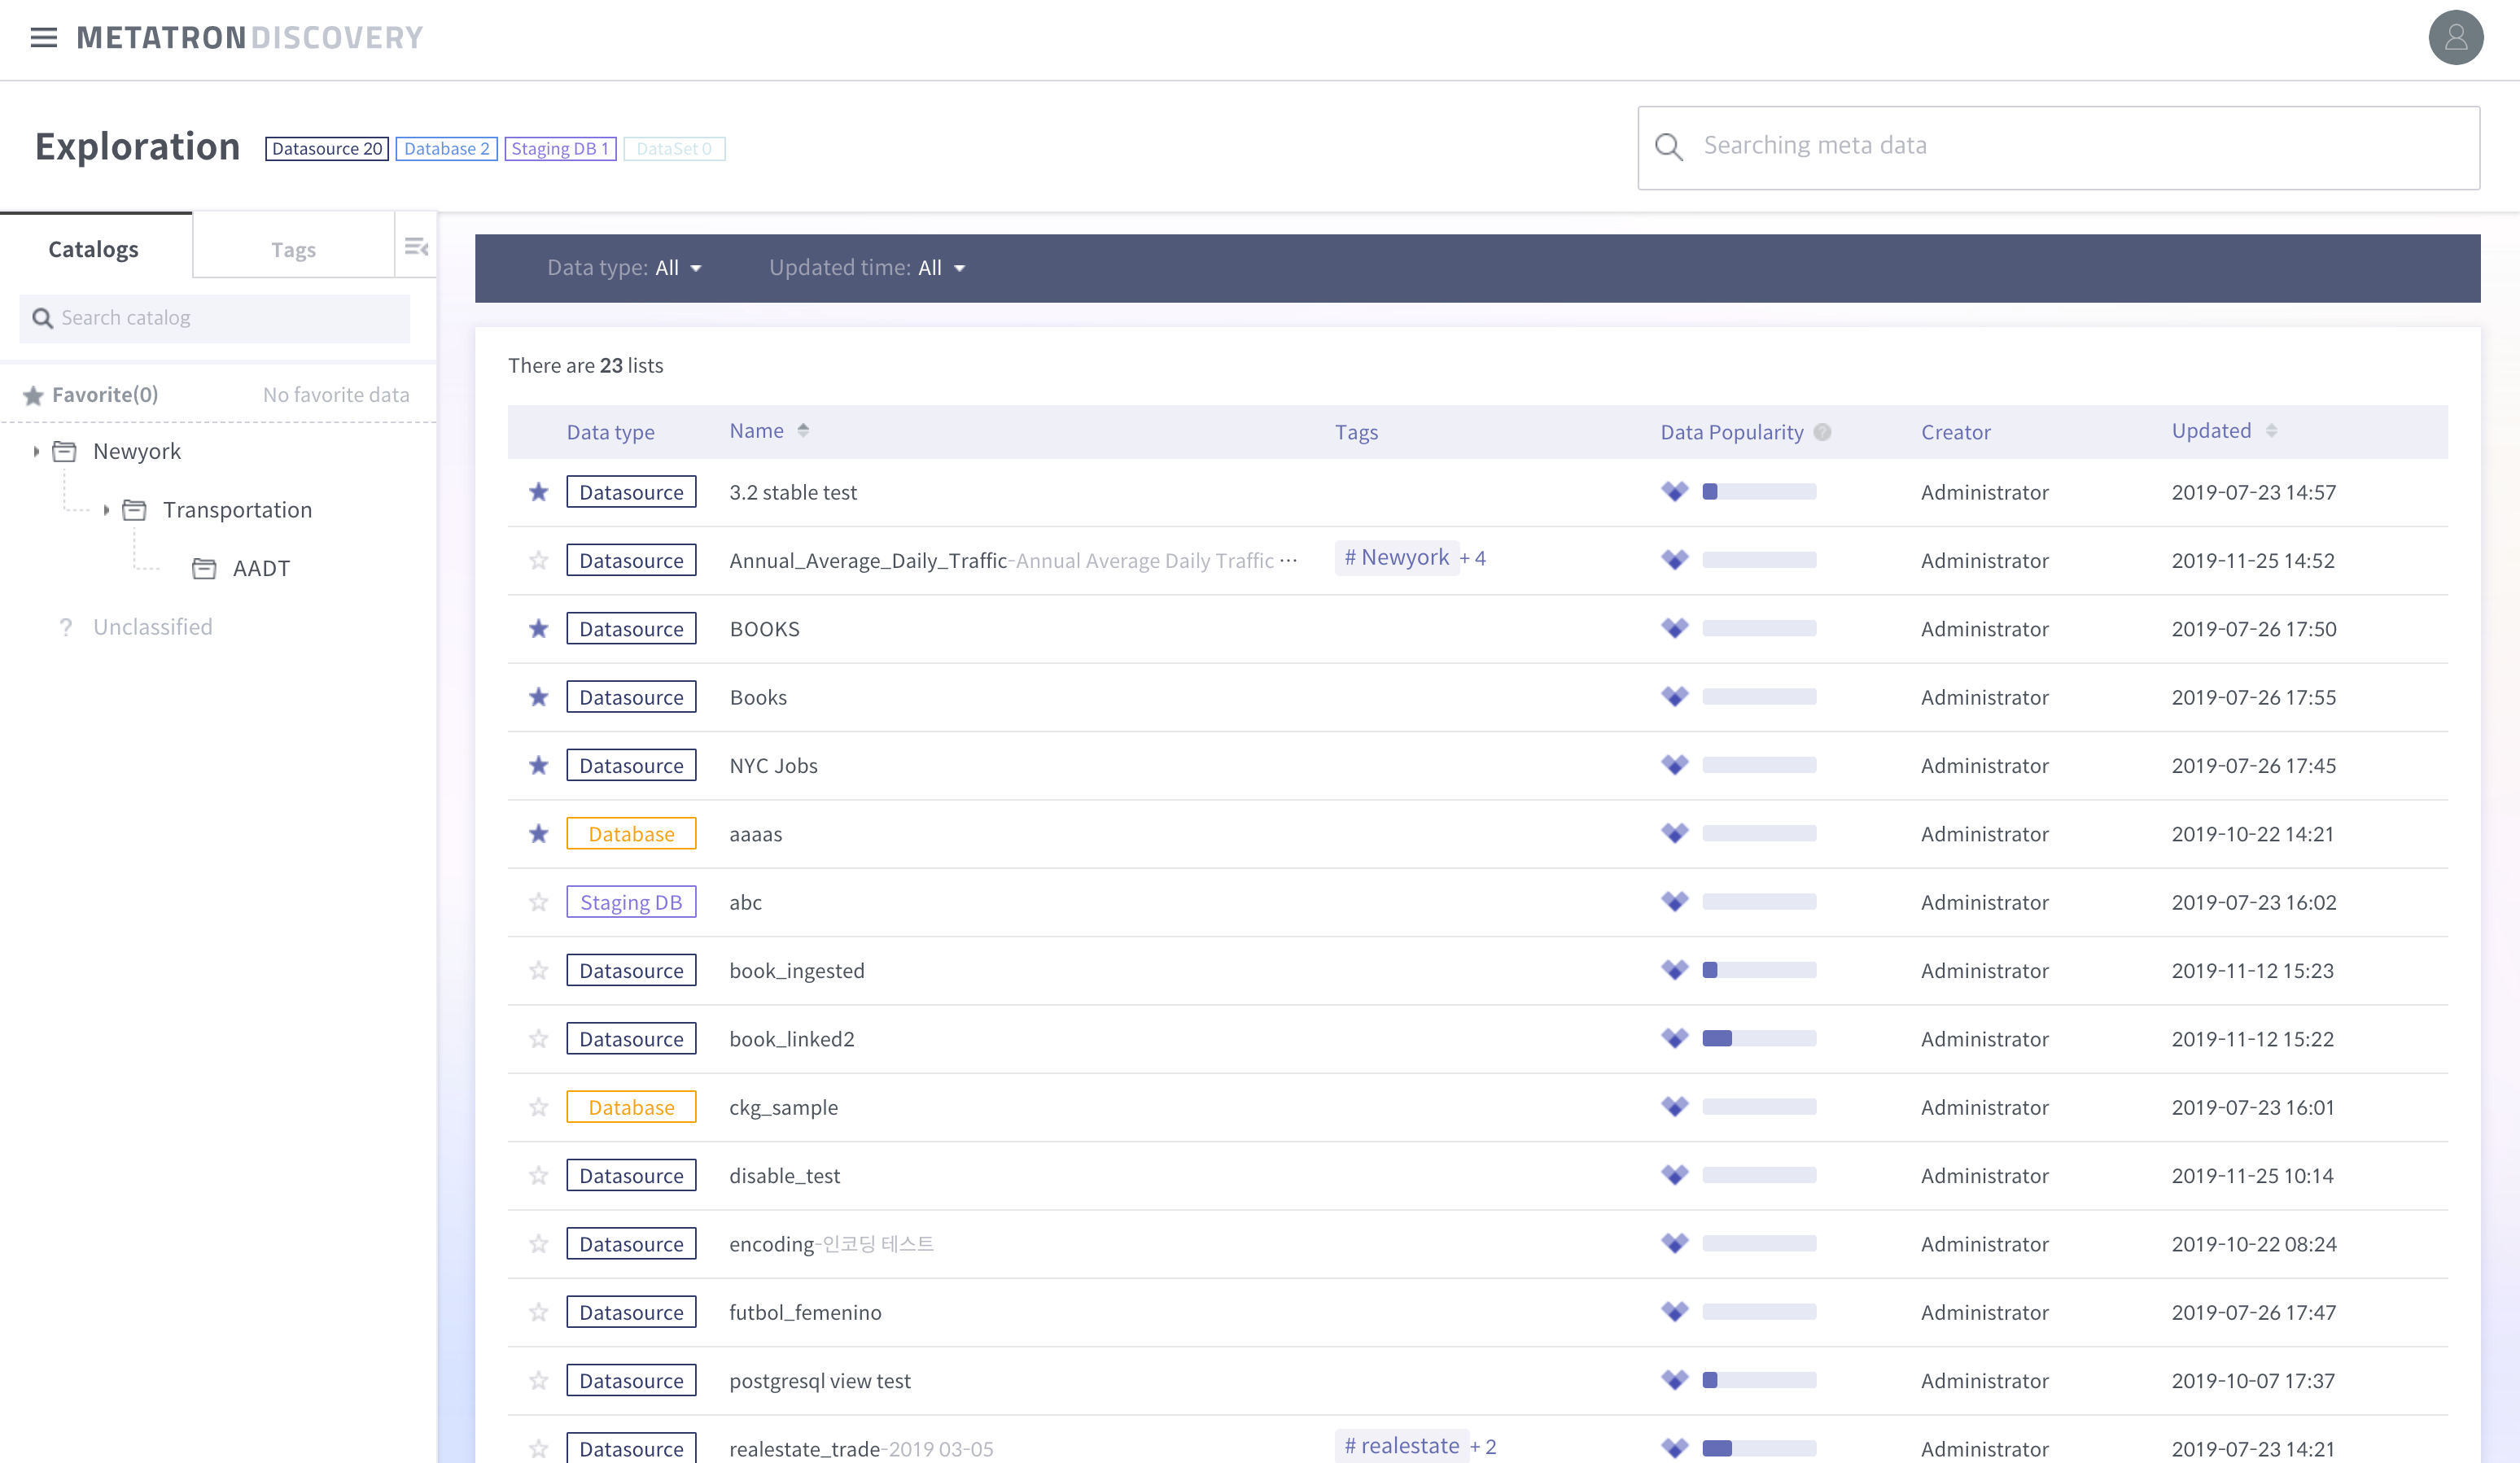
Metadata List
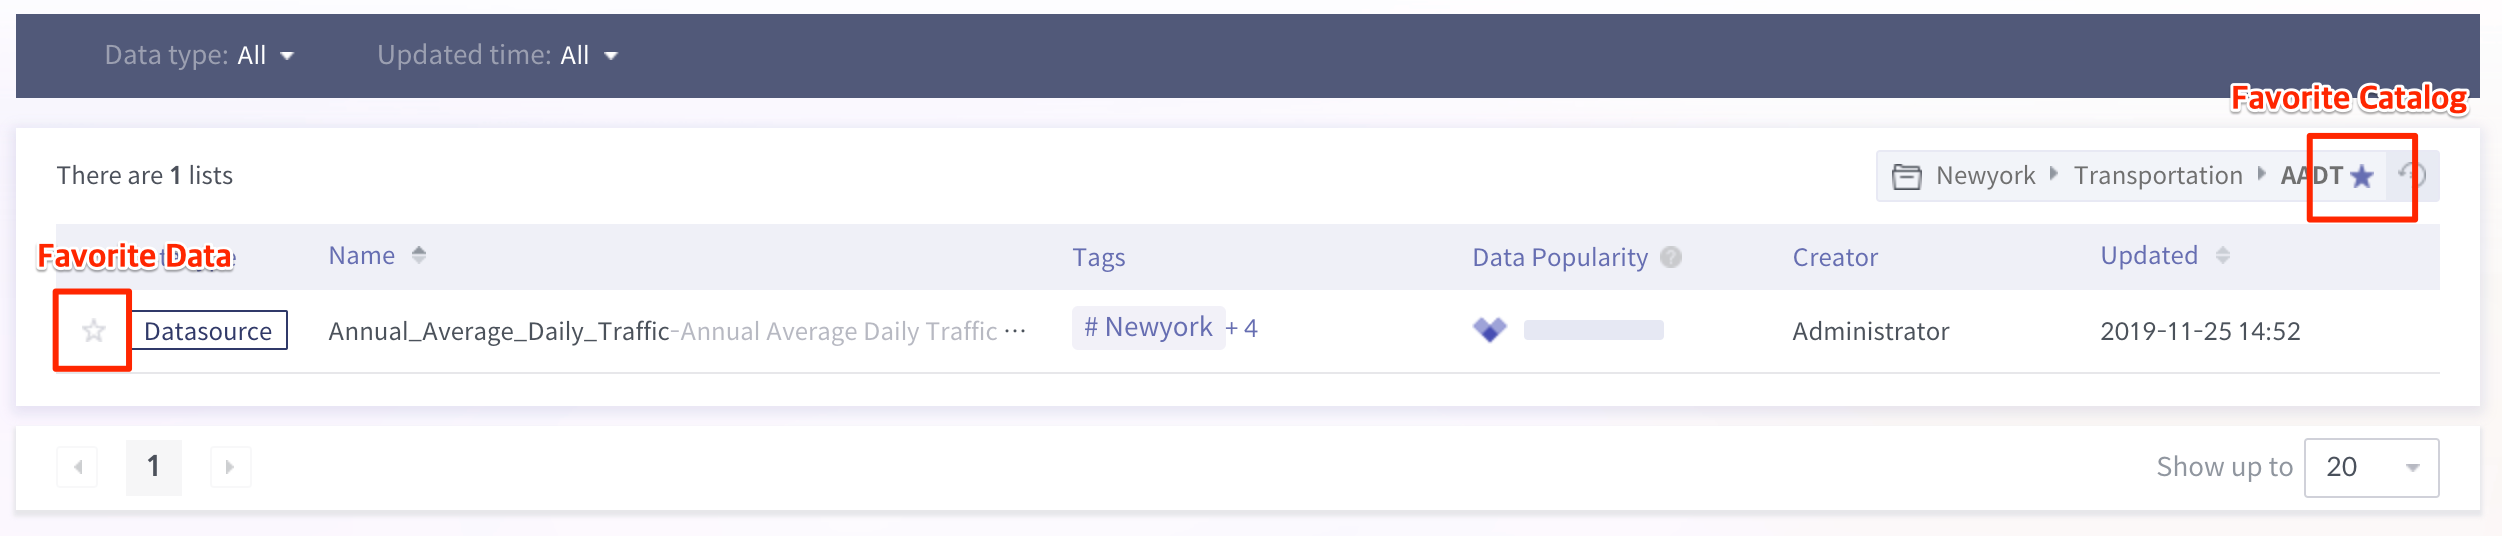
Favorite Data/Catalog
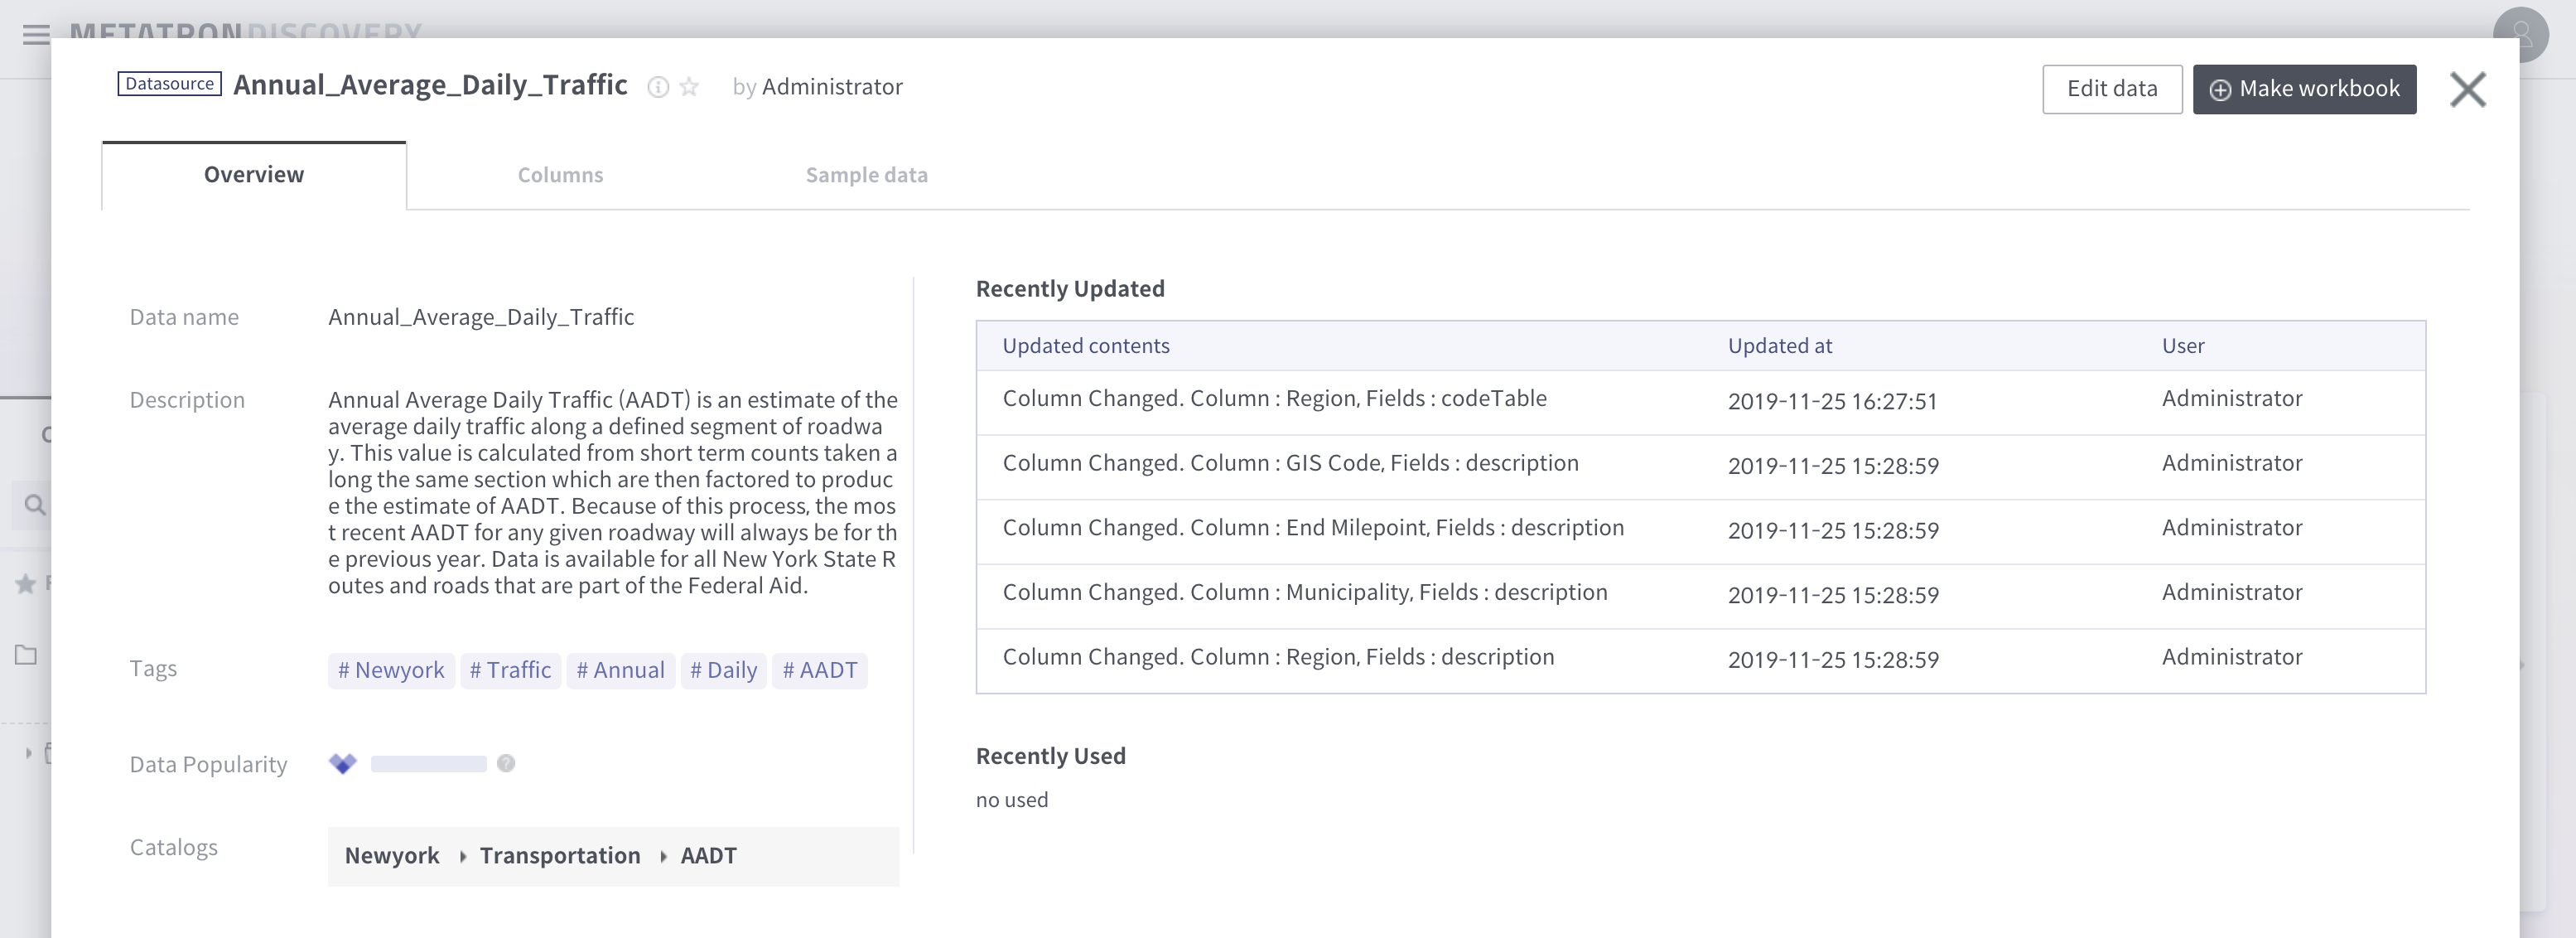
2. Understanding Metadata
Let’s click on the New York traffic data we just created to see the information.
Basically, you can check the data entered by the creator, and go to the Columns tab and Sample Data tab to get a closer look at the data.Overview
3. Collaborate on Metadata
Let’s take a look at the additional information to get Insight on the Overview tab.
Overview
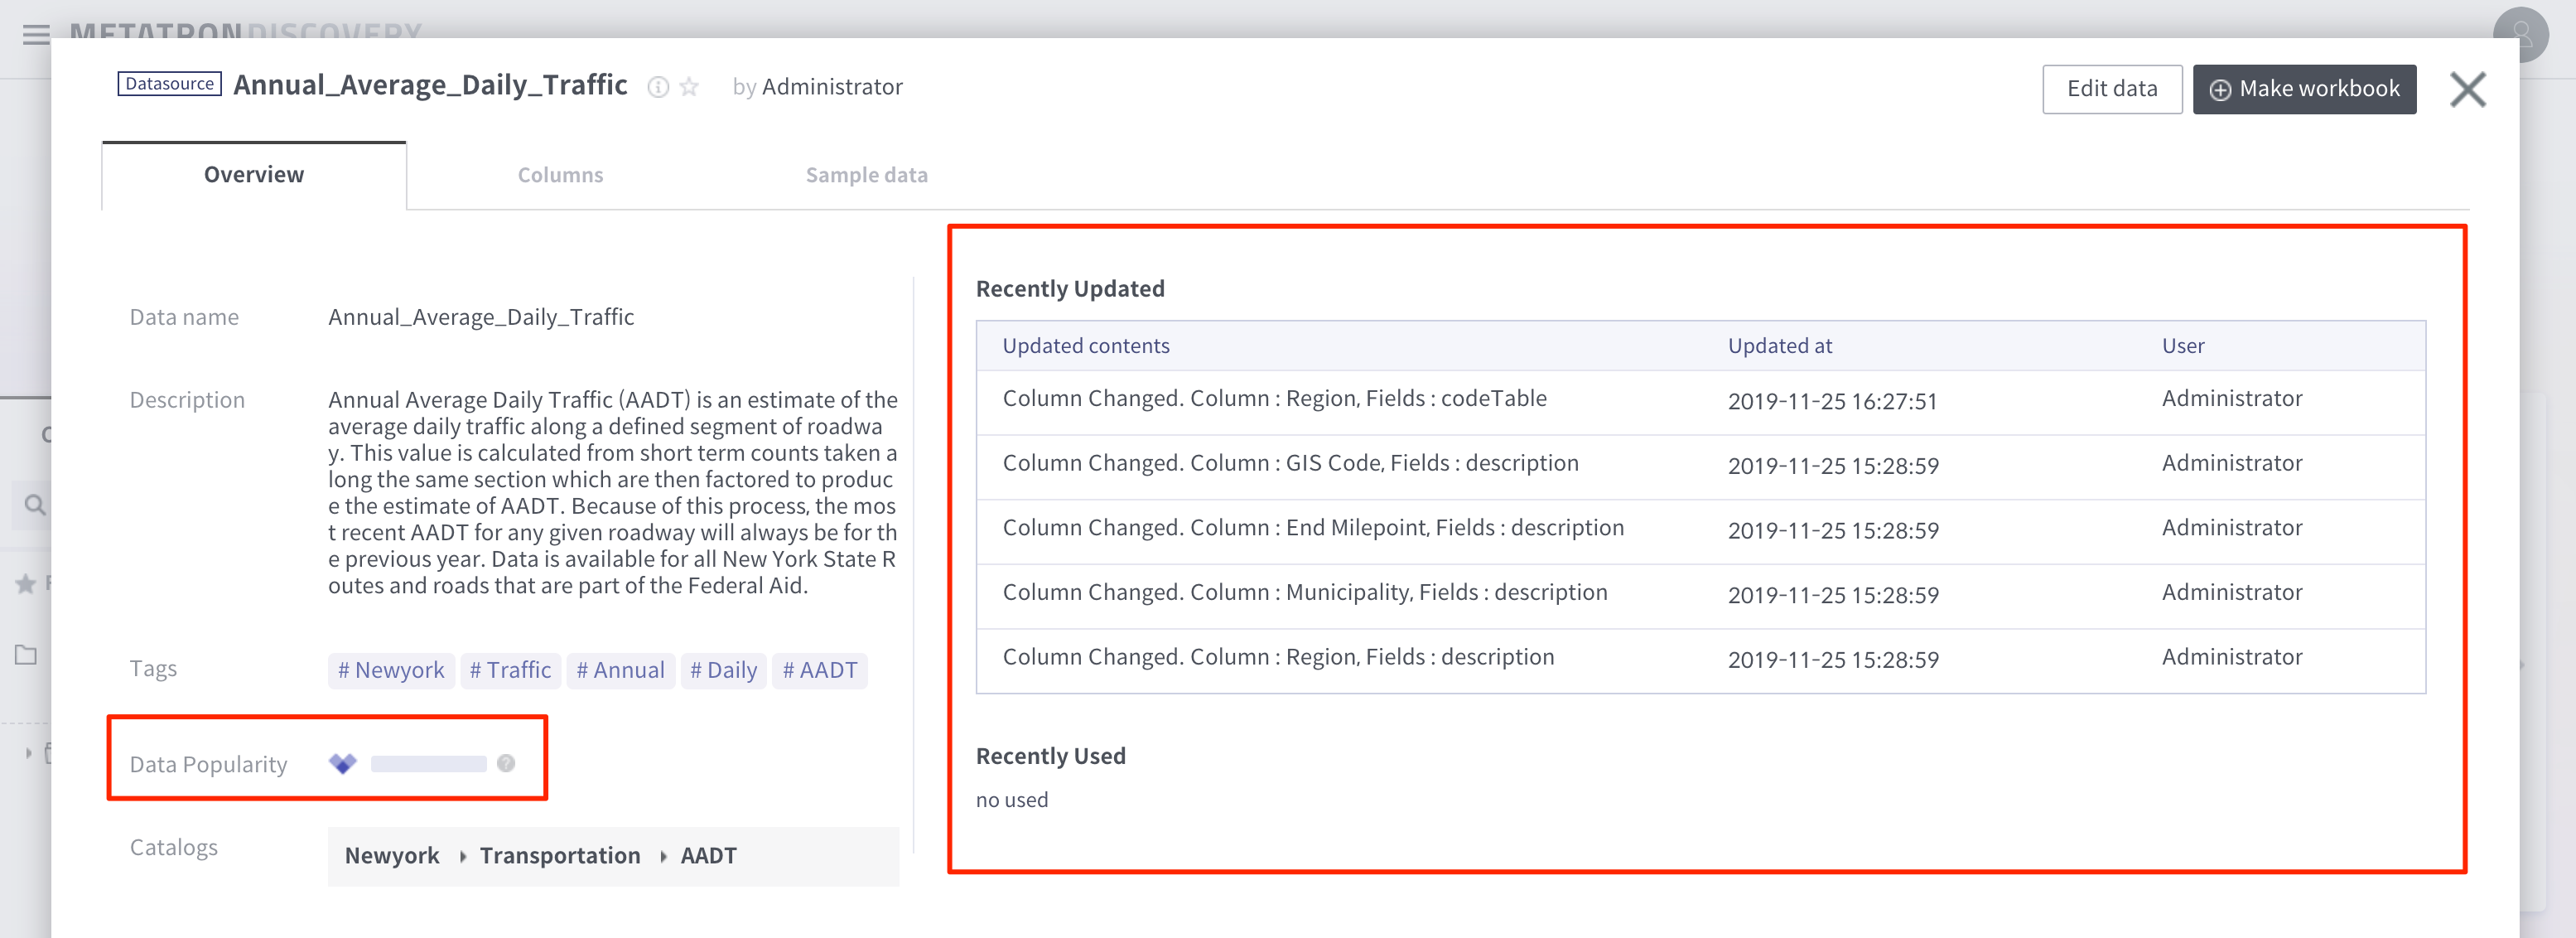
Overview
Because no user has used this data yet.
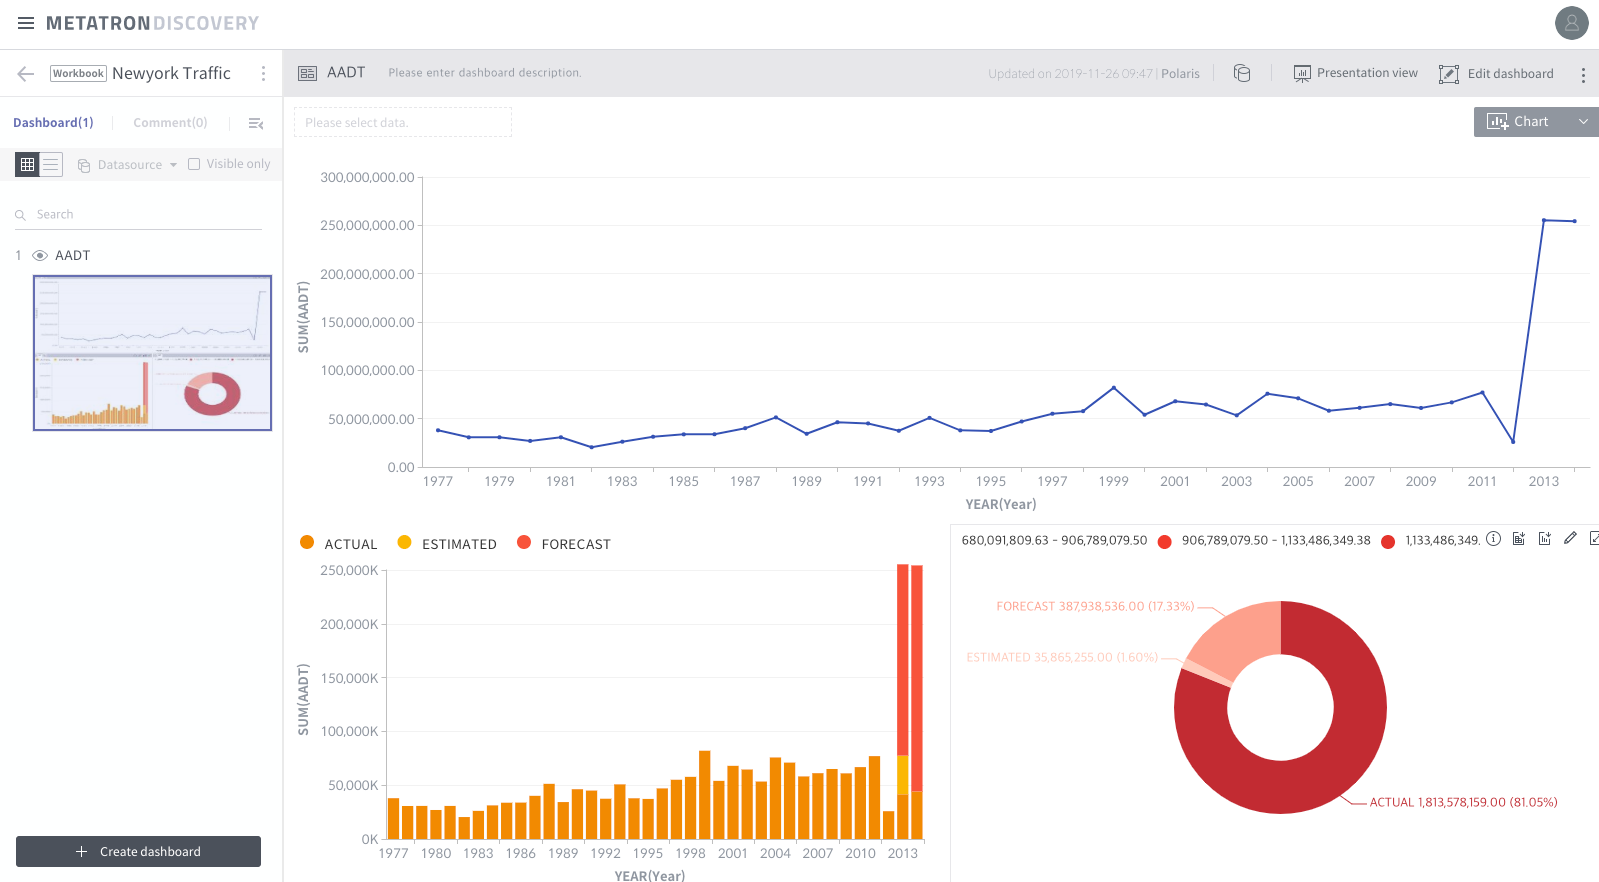
Sample Dashboard
-
Popularity
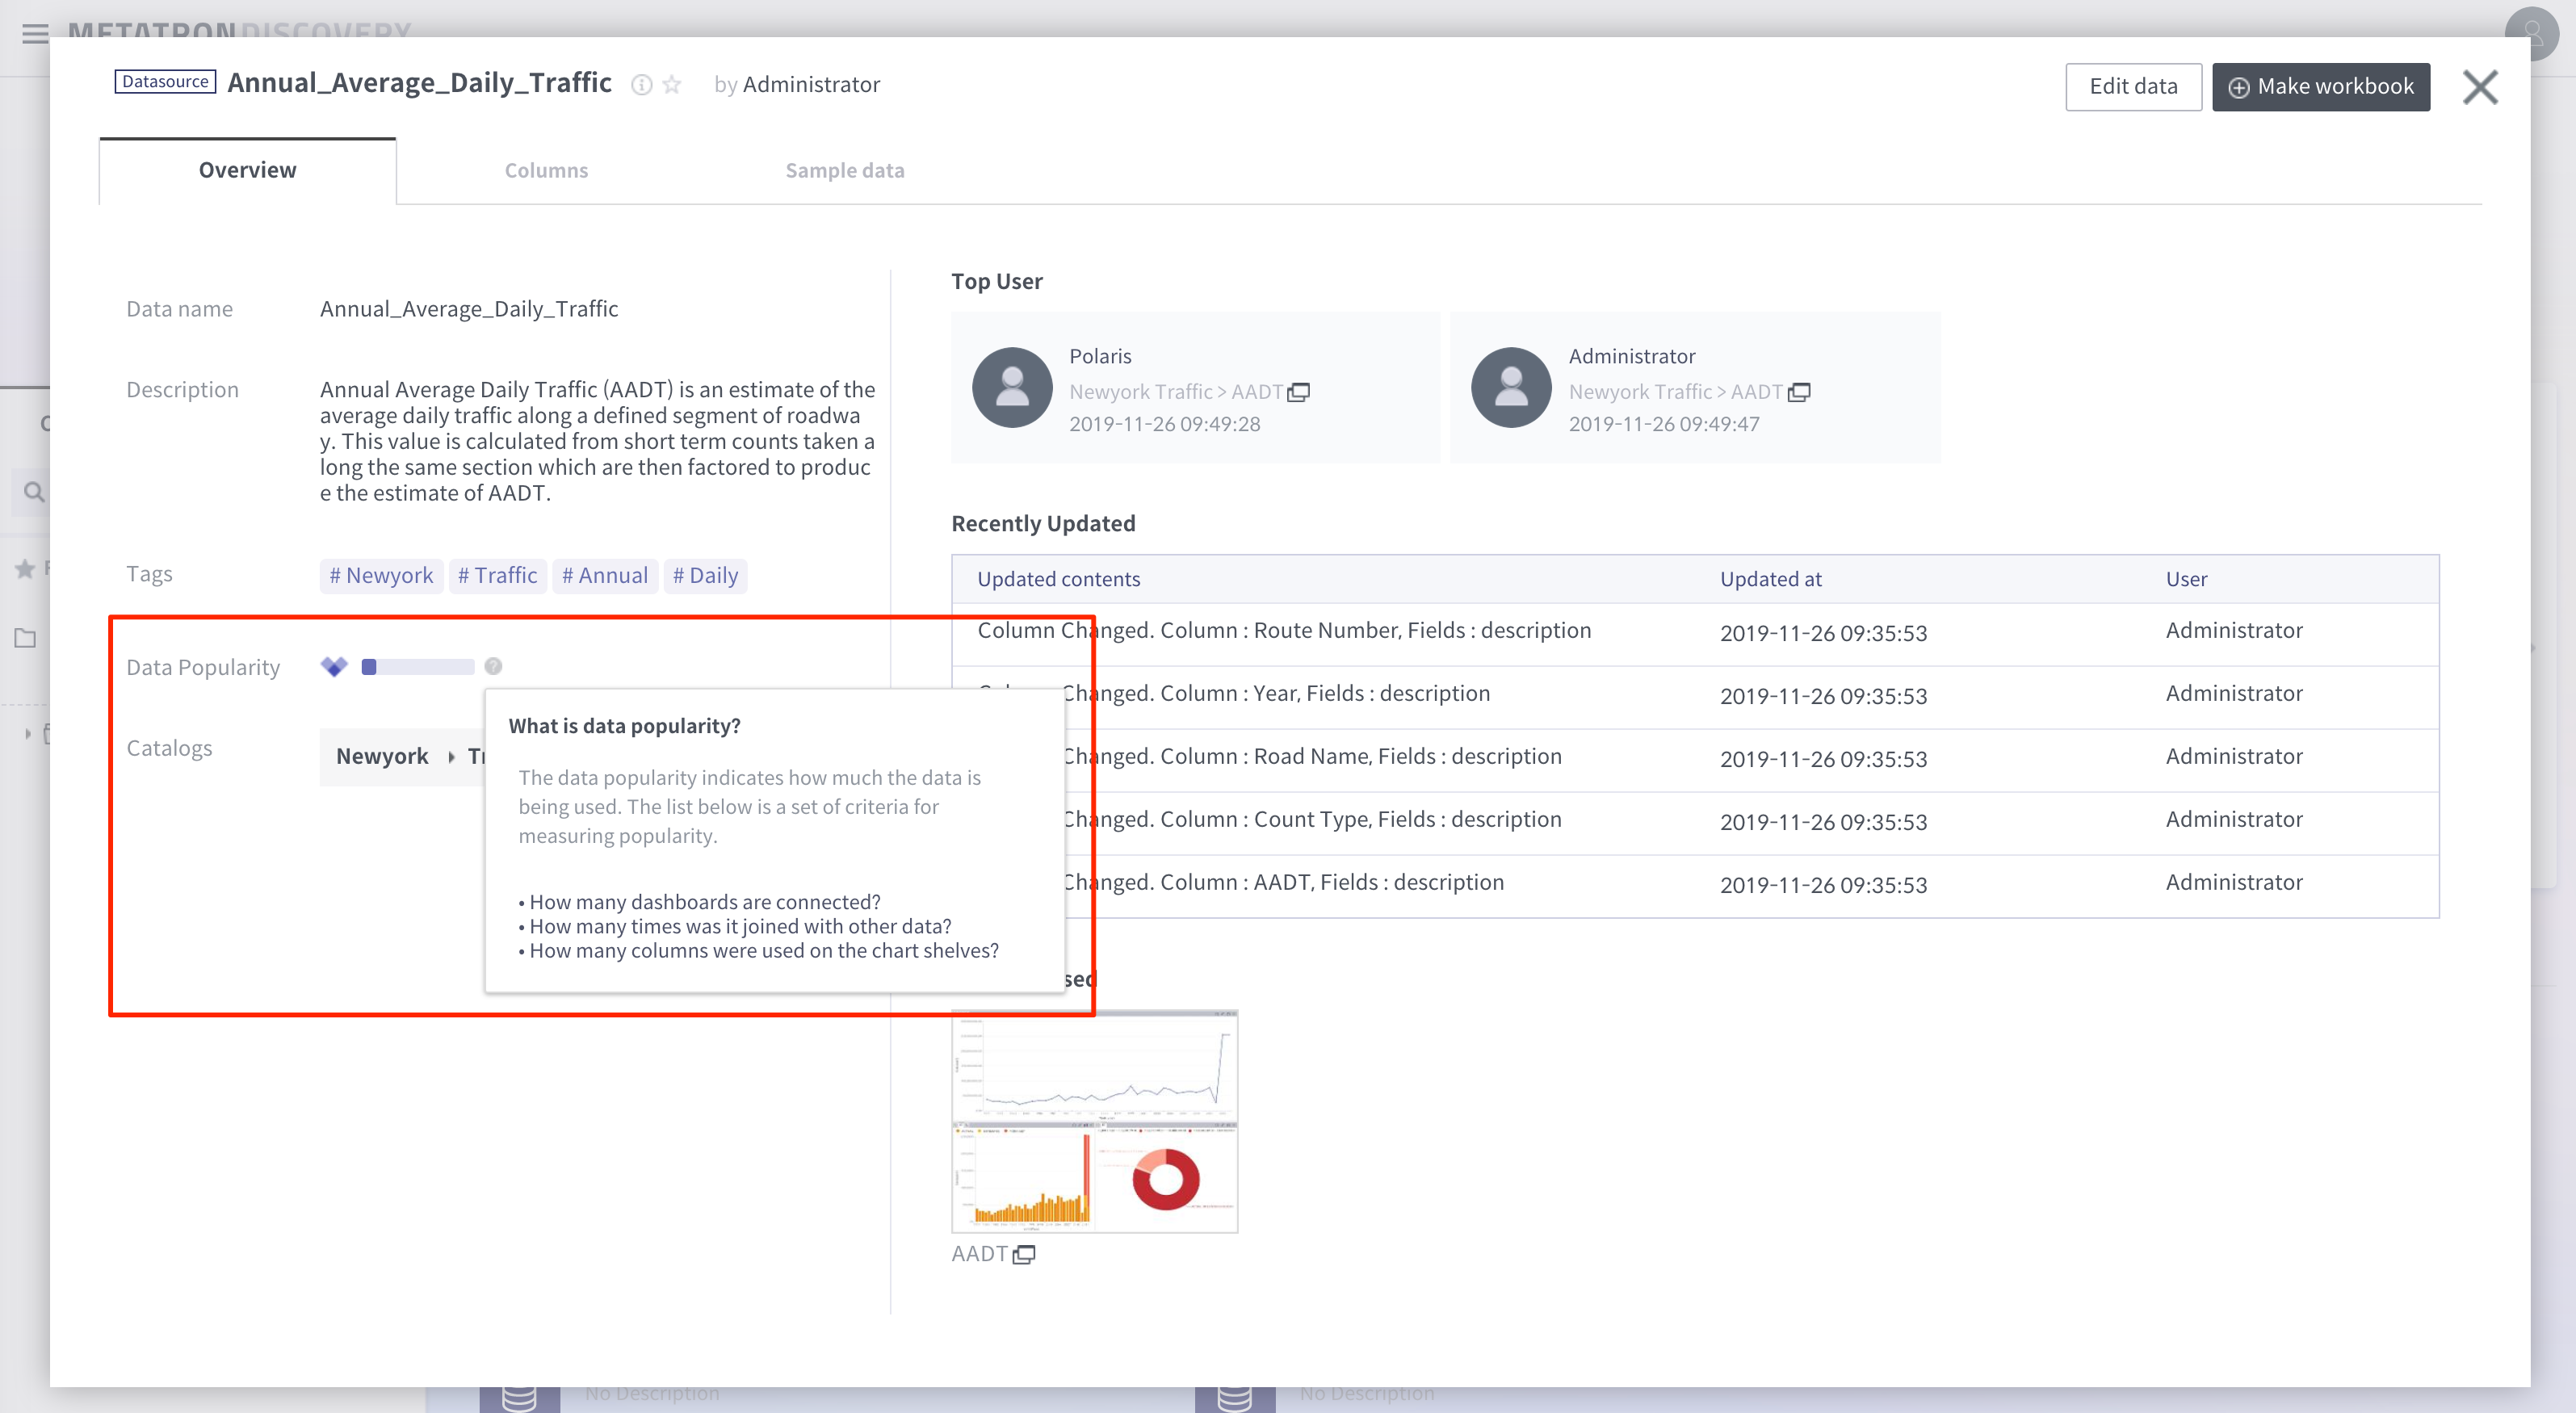
Data Popularity
Column Popularity
Each time a user creates a dashboard with data, the data popularity score is increased by 1.
It also calculates the popularity score of the column you used in the chart as 1.
The relative popularity is calculated based on this score.
-
Top User
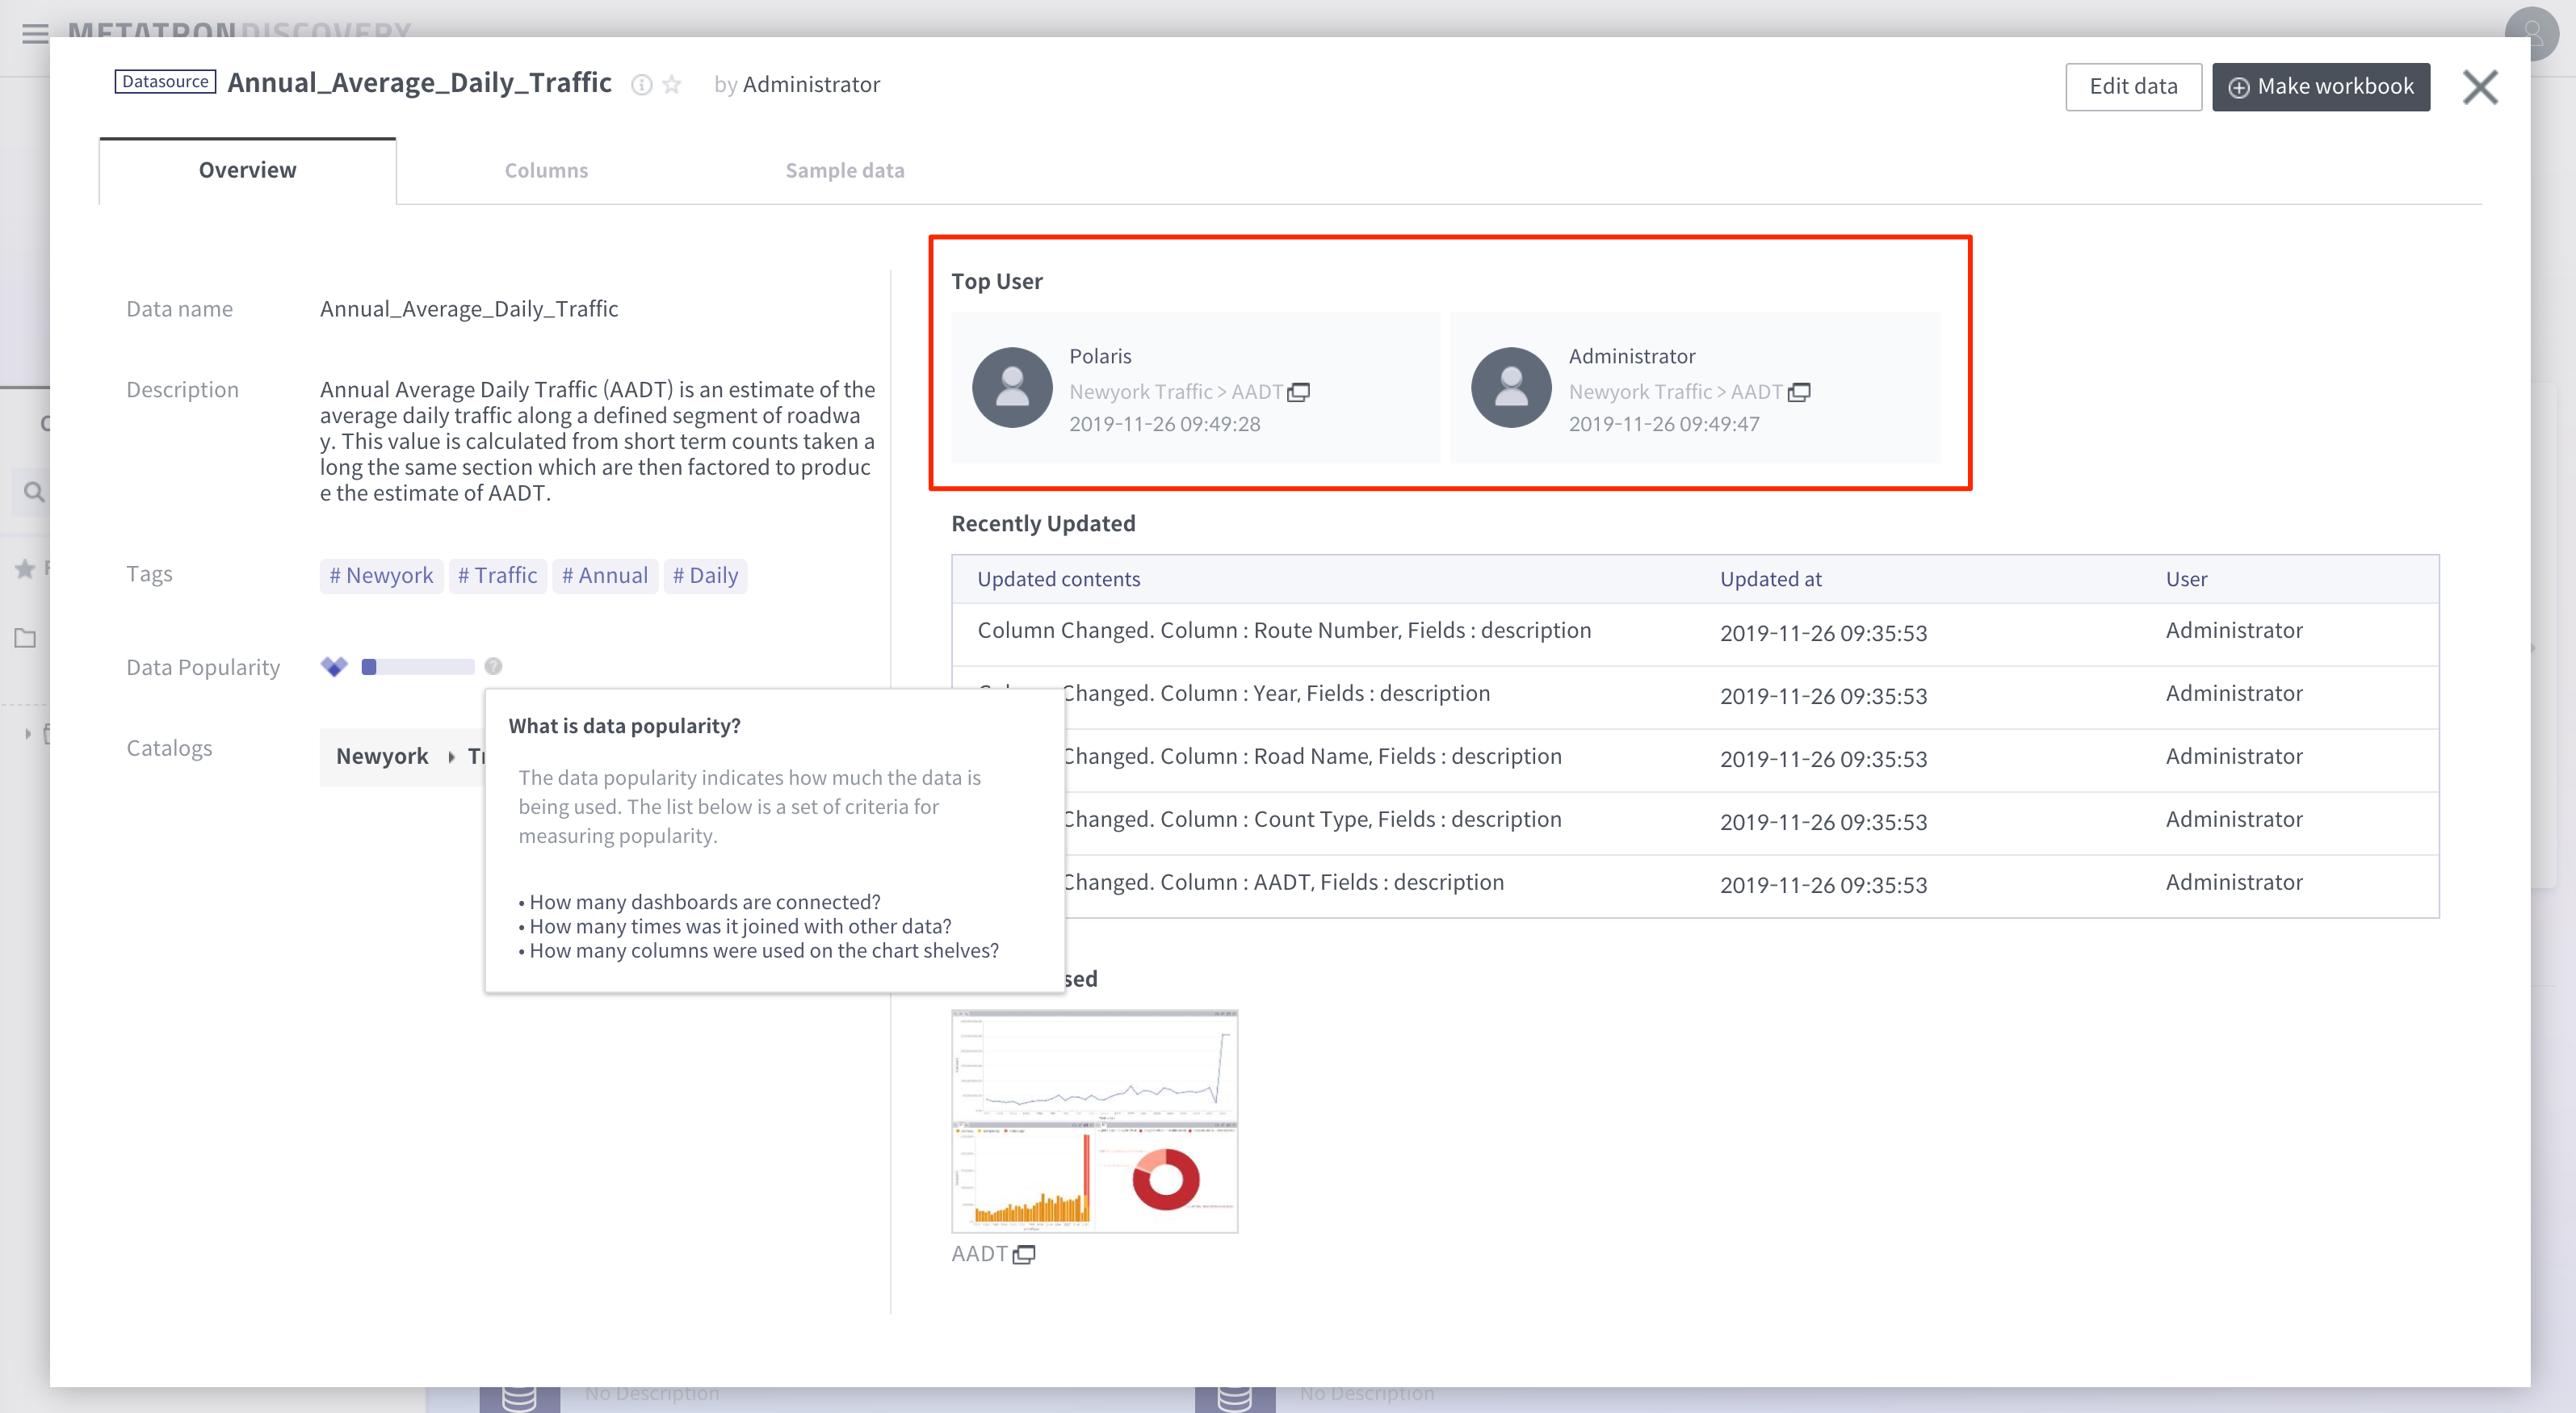
Top3 is shown in the order of users who visited the dashboard created using this data. And you can see what dashboard the user last visited.
If you have permission to view the dashboard, you can also view the chart directly by clicking on the link.
-
Recently Used
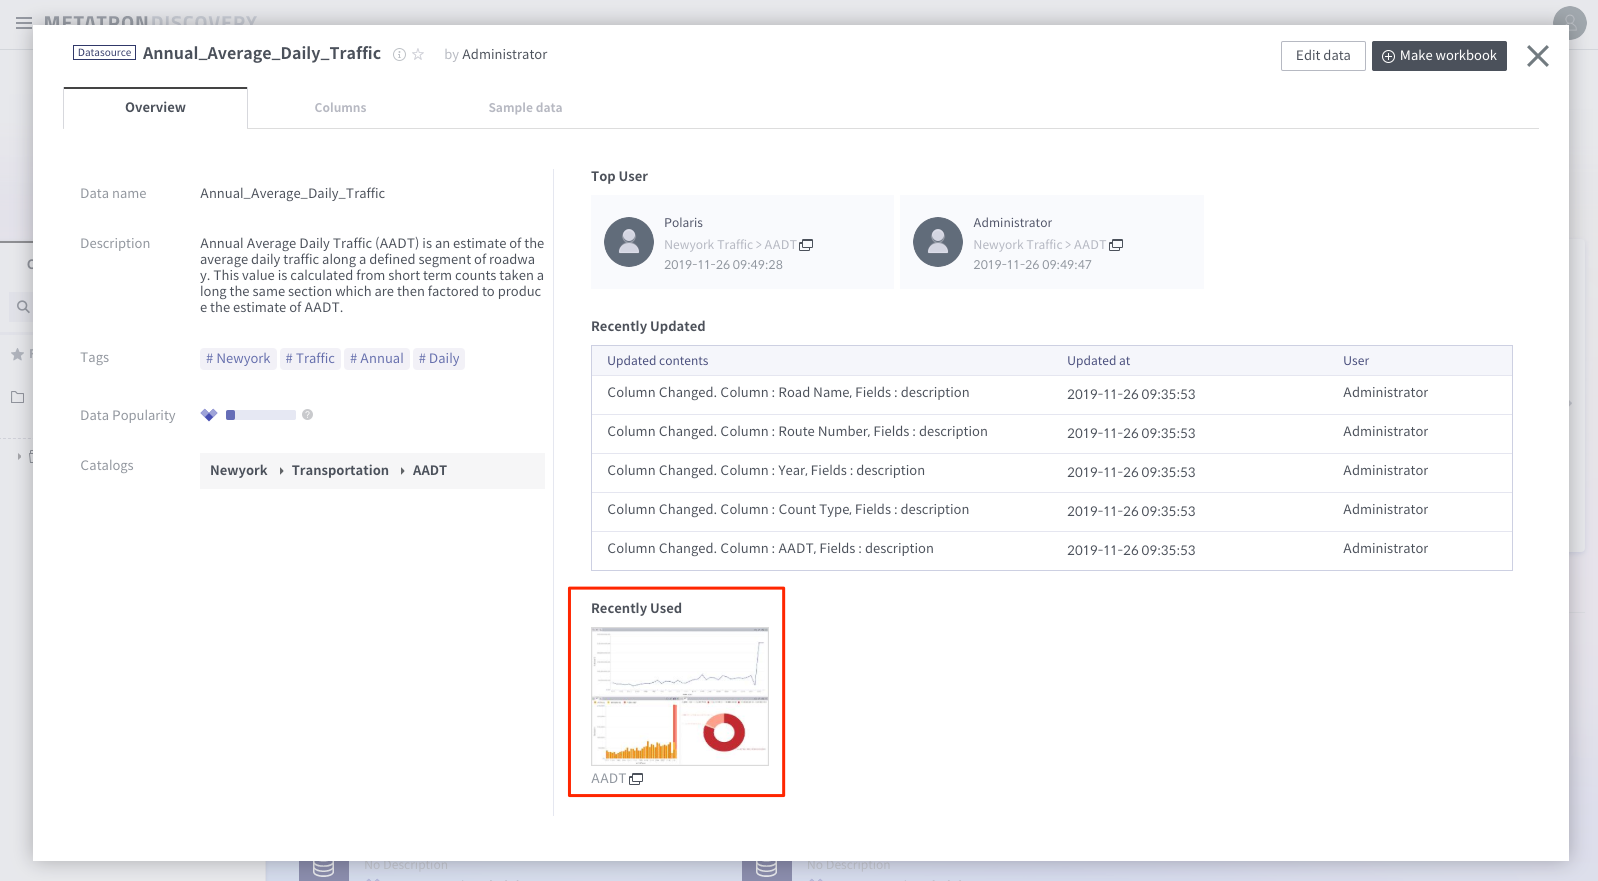
A list of thumbnails of dashboards that users have created with this data.
You can see how users are looking at this data.
You can also get insights on how to use data.
If you have found an attractive dashboard thumbnail, you can also go directly to the dashboard to explore the data.
- Discussion about data
- Data Confidence with user voting
- Data Histogram in Preview
- Integration with Dashboard
- Link to Workbench