Evaluation on Druid
Notice: Undefined offset: 1 in /data/httpd/www/html/wp-includes/media.php on line 70
Evaluation on the Druid’s performance
Since the Druid aims for real-time search data store, performance evaluation focuses on two aspects:
– Query latency
– Ingestion latency
Minimizing consumed time on query processing and data ingestion is the key to being ‘real-time’. Following is the evaluations on Druid by Druid developers and SK Telecom. This paper further introduces Druid’s comparison with Apache Spark.
Druid Developers
Druid Developers released a whitepaper ‘Druid: A Real-time Analytical Data Store’ in 2014. ‘Chapter 6. Performance’ explains their evaluation on Druid’s query and ingestion latency in detail.
Query Latency
The paper compared 8 practical datasets and TPC-H dataset on query results. Query latency of TPC-H dataset was proceeded by comparing it with MySQL. Following clusters were used in comparing:
- Druid historical node: Amazon EC2 m3.2xlarge instance types (Intel® Xeon® E5-2680 v2 @2.80GHz)
- Druid broker node: c3.2xlarge instances (Intel® Xeon® E5-2670 v2 @2.50GHz)
- MySQL Amazon RDS instance (m3.2xlarge instance type same as above)
Below is a graph of Druid and MySQL single node comparison results on 1GB and 100GB TPC-H dataset.
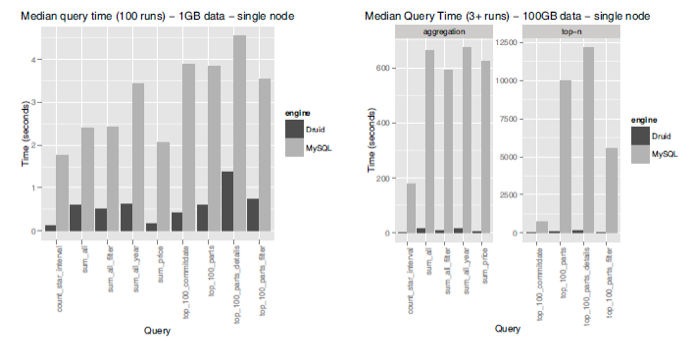
Druid and MySQL Benchmark (1GB and 100GB TPC-H dataset)
These results imply that adapting druid can improve query speed on a ground-breaking scale compared to existing relational database system.
Imply also measured improvements of query processing speed when combining nodes into clusters. 100GB TPC-H dataset was used for querying. Differences between single nodes (8 cores) and 6 node clusters (48 cores) were as follows:
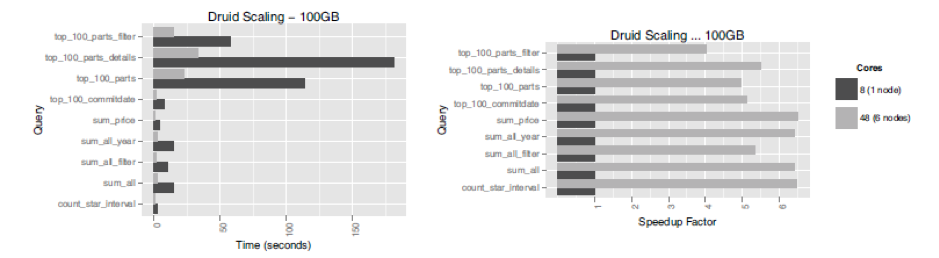
Druid Scaling Benchmark (100GB TPC-H dataset)
Not all queries reached linear scalability, but relatively simple queries showed distinct speed improvement – almost in direct proportional amount of number of cores. (SK Telecom’s metatron additionally improved this function for more vivid achievement of linear scalability.)
Ingestion Latency
The paper also evaluated on Druid’s ingestion performance. Following cluster environment was used:
6 nodes, of total 360GB memory and 96 cores (12 x Intel® Xeon® E5-2670)
8 practical data sources were ingested. Specification of each data sources and ingestion results were as follows. In addition, during the ingestion test, ingestions of other data sources were carried out at the same time on each clusters.
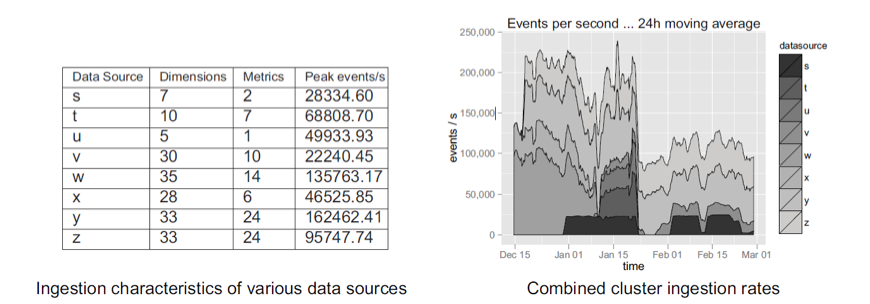
Druid Ingestion Dataset Specifications and Speed Results
Data ingestion speed tends to be affected by various factors such as complexity of the data. However, the results shows that it mostly suits Druid’s development goals.
SK Telecom
Query Latency
Query latency was tested on following conditions:
- Data: TPC-H 100G dataset (900 million rows)
- Pre-aggregation interval: day
- Server: r3.4xlarge nodes, (2.5GHz * 16, 122G, 320G SSD) * 6
- 6 Historical nodes
- 1 Broker node
Return speed of 5 queries of TPC-H 100G dataset resulted as (query processing speed of Hive was tested together as a reference):
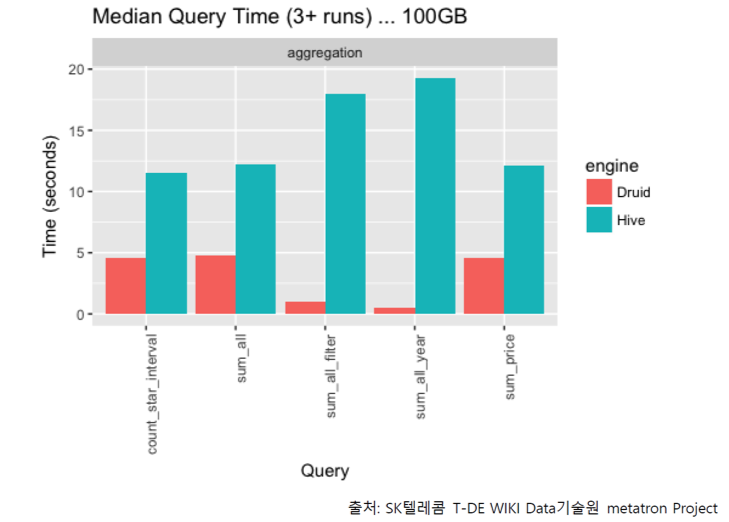
Druid and MySQL Benchmark (100GB TPC-H Dataset)
* Benchmark of Hive is remarkably behind partly because it was tested with Thrift and the test set was consisted without partitions.
Ingestion Latency
Ingestion latency was tested on following conditions:
- Ingestion data size: 3000 million rows, 10 columns a day
- Memory: 512GB
- CPU: Intel® Xeon® Gold 5120 CPU @ 2.20 GHz (56 cores)
- 100 Historical nodes
- 2 Broker nodes
- 3 out of 10 Middle managers were used to process the job
- Ingestion tool: Apache Kafka
Data ingestion was repeated 100 times on the same conditions as above. Average ingestion latency was 1.623439 seconds. Ingestion latency is the total processing time of Kafka ingestion, Druid ingestion and Druid query added altogether. Here is a diagram to help understanding:
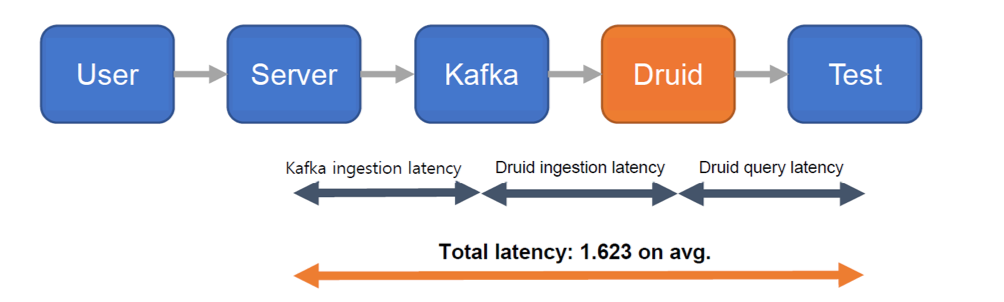
Ingestion Latency Test Architecture and Total Latency
Comparison with Apache Spark
Both Druid and Spark are spotlights of next generation big data analysis solution and since they each have different pros and cons, they are a great complement for each other. metatron is utilizing such synergy very well by using Druid as a data storage/process engine and Spark as an advanced analysis module.
On this paper we will briefly go through the contents of report on Druid vs Spark performance comparison, released by Harish Butani of Sparkline Data Inc.
About Apache Spark
Apache Spark is an open-source cluster computing framework which provides variety of APIs consisted of Java, Scala, Python, and R. Spark aims to build an integrated analysis solution of SQL, machine learning, and graph processing. Spark has powerful support on processing huge scaled or complex data, but is not optimized for interactive query process like Druid.
Dataset, Queries, Performance Comparison
TPC-H 10G benchmark data set was used. Originally, this dataset has a schema structure suitable for relative database. Therefore, they de-normalized it and reformatted in a process-able form of Druid and Spark. Size of these datasets were:
- TPC-H Flat TSV: 46.80GB
- Druid Index in HDFS: 17.04GB
- TPC-H Flat Parquet: 11.38GB
- TPC-H Flat Parquet Partition by Month: 11.56GB
Then they consisted queries to analyze query processing speed on various aspects:
(Source: Combining Druid and Spark:Interactive and Flexible Analytics at Scale)
| Query | Interval | Filters | Group By | Aggregations |
|---|---|---|---|---|
| Basic Aggregation | None | None | ReturnFlag LineStatus |
Count(*) Sum(exdPrice) Avg(avlQty) |
| Ship Date Range | 1995-12/1997-09 | None | ReturnFlag LineStatus |
Count(*) |
| SubQrt Nation, pType ShpDt Range | 1995-12/1997-09 | P-Type S_Nation+C_Nation | S_Nation | Count(*) Sum(exdPrice) Max(sCost) Avg(avlQty) Count(Distinct oKey) |
| TPCH Q1 | None | None | ReturnFlag LineStatus |
Count(*) Sum(exdPrice) Max(sCost) Avg(avlQty) Count(Distinct oKey) |
| TPCH Q3 | 1995-03-15- | O_Date MktSegment | OKey ODate ShipPri |
Sum(exdPrice) |
| TPCH Q5 | None | O_Date Region |
S_Nation | Sum(exdPrice) |
| TPCH Q7 | None | S_Nation+C_Nation | S_Nation C_Nation ShipDate.Year |
Sum(exdPrice) |
| TPCH Q8 | None | Region Type O_Date |
ODate.Year | Sum(exdPrice) |
Queries Used in Druid and Apache Spark Query Latency Comparison Test
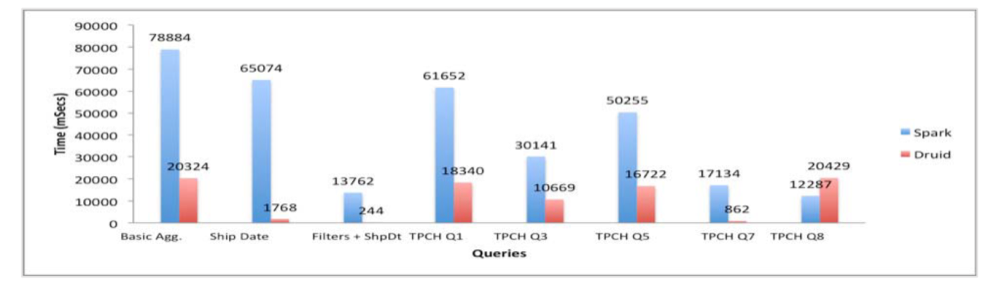
The results were as follows:
Results of Druid and Apache Spark Query Latency Test
- Filters + Ship Date query was used to test Druid’s specialized function, slice-and-dice. As expected, its speed was 50 times faster. Likewise, on processing TPC-H Q7 queries, time consumed on Druid was few milliseconds while on Spark it was few seconds.
- On TPC-H Q3, Q5, Q8 queries, Druid did not show maximized efficiency like the above case. OrderDate predicate is comprehended through JavaScript filter on Druid, which is remarkably slower than native Java filter.
- Druid also showed much faster process speed on Basic Aggregation and TPC-H Q1 queries. On Druid, Count-Distinct action is comprehended through cardinality aggregator, which is part of approximate count. This makes Druid advantageous when searching big cardinality dimensions.
Outcomes can differ depending on conditions. However, one obvious fact is that Druid is significantly fast in processing queries that include time partitioning or dimensional predicates.
Implication
These outcomes imply that combining Druid’s high speed query process ability and Spark’s advanced analysis function would create an excellent synergy. We would extract the needed data fast and efficiently with Druid, then use Spark’s abundant programming APIs to perform in-depth analysis. By doing so, we can establish an analysis solution that is strong, flexible and low on query latency rate.