Analyzing geospatial data with Metatron Discovery
In this example, we use Metatron Discovery to load Geo data into Druid, and use it to display location information on the map.
We use the Docker version of Metatron Discovery for ease of installation. Ingestion using the Docker version requires at least 6G of memory. Please refer to the following URL for installation using Docker.
First, you need a geosptial data! Free to download the sample data, sample geodata about sales performance.
Then create a datasource on the Druid using the downloaded .csv file. You must log in with an account with Data Administrator privileges to create a datasource. For convenience, we use the admin account here.
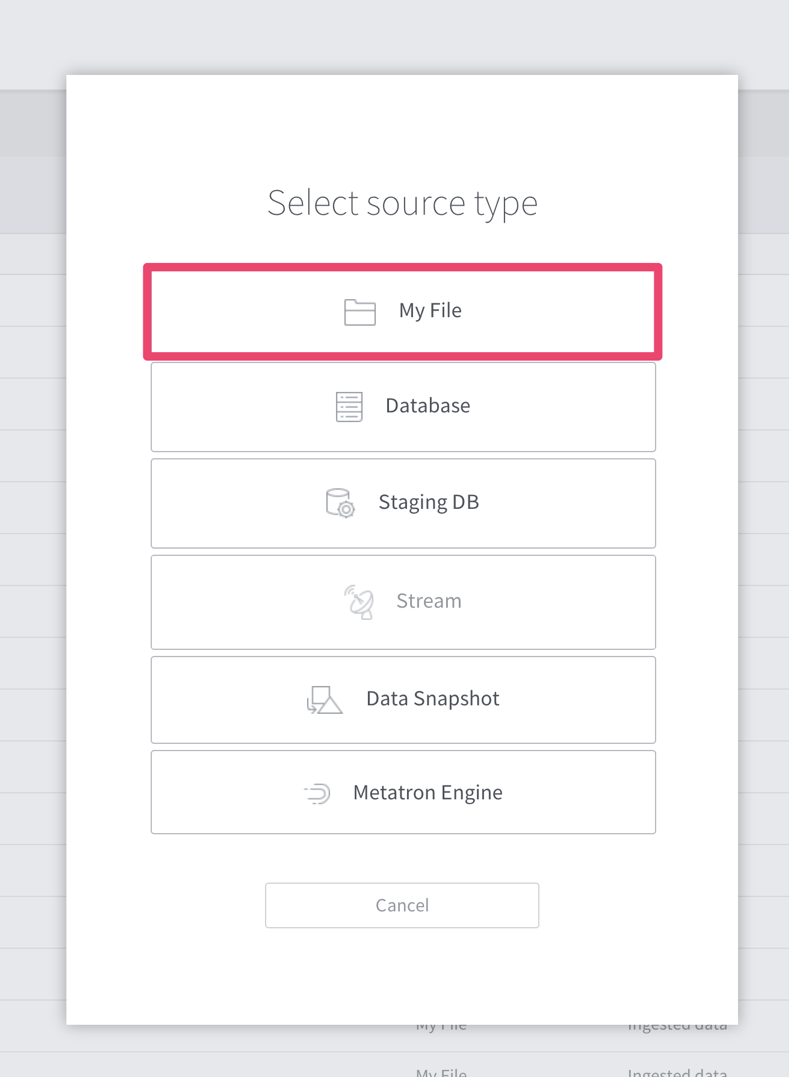
[Figure 1] Select source type
When the file uploading screen appears, upload the downloaded csv file. After uploading the file and determine which sheet to use, a screen is displayed to define the schema of the datasource. Then determine the role and type of the field.
Here we define the fields as follows:
- Change role of Discount, SalesperCustomer, ProfitRatio column to Measure and define type as Decimal
- Change the role of the Profit, Quantity, Sales, and SalesForecast columns to Measure and define the type as Integer
- Change OrderDate field type to Date / Time
- Change latitude field type to Latitude
- Change longitude field type to Longitude
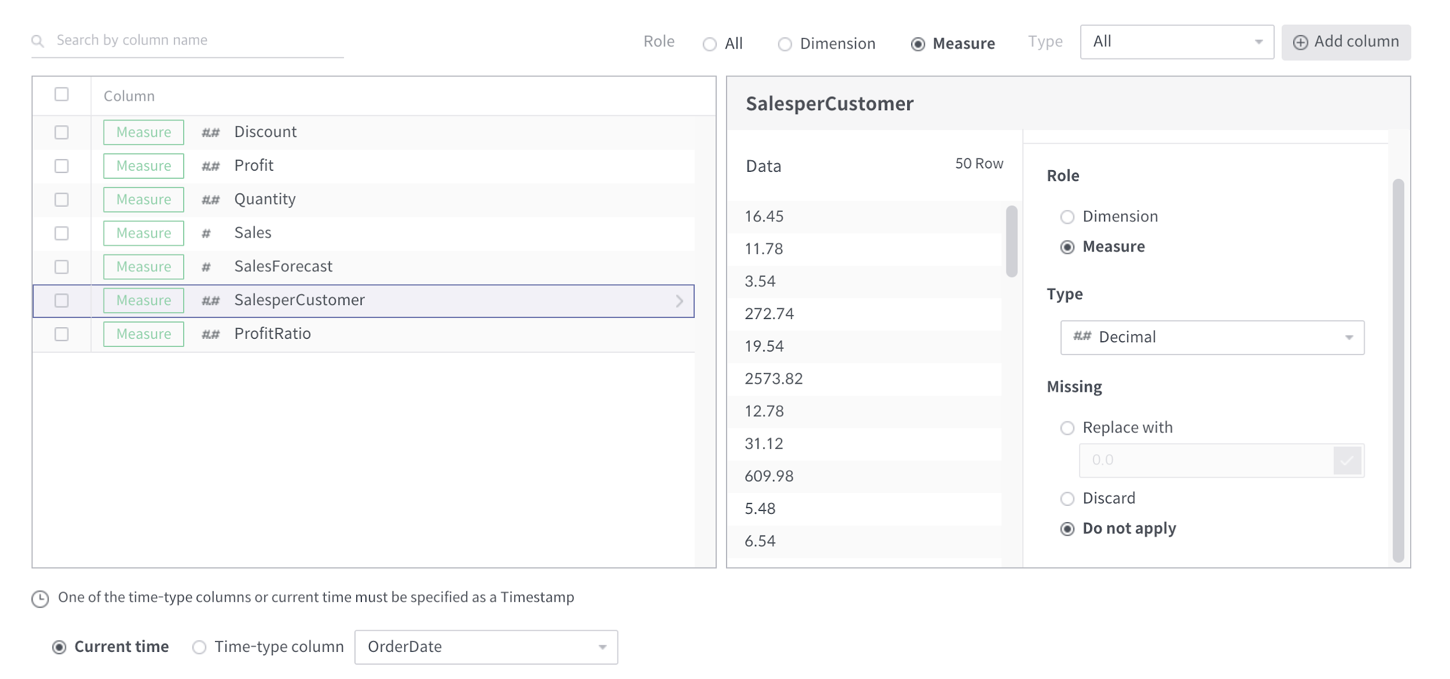
[Figure 2] Configure schema – Measure role
After that, select the Add column button to create a new field. Select Point for the selection method and the previously defined latitude and longtude columns for the Latitude column and Longitude column. Add a new column with the column name as the location.
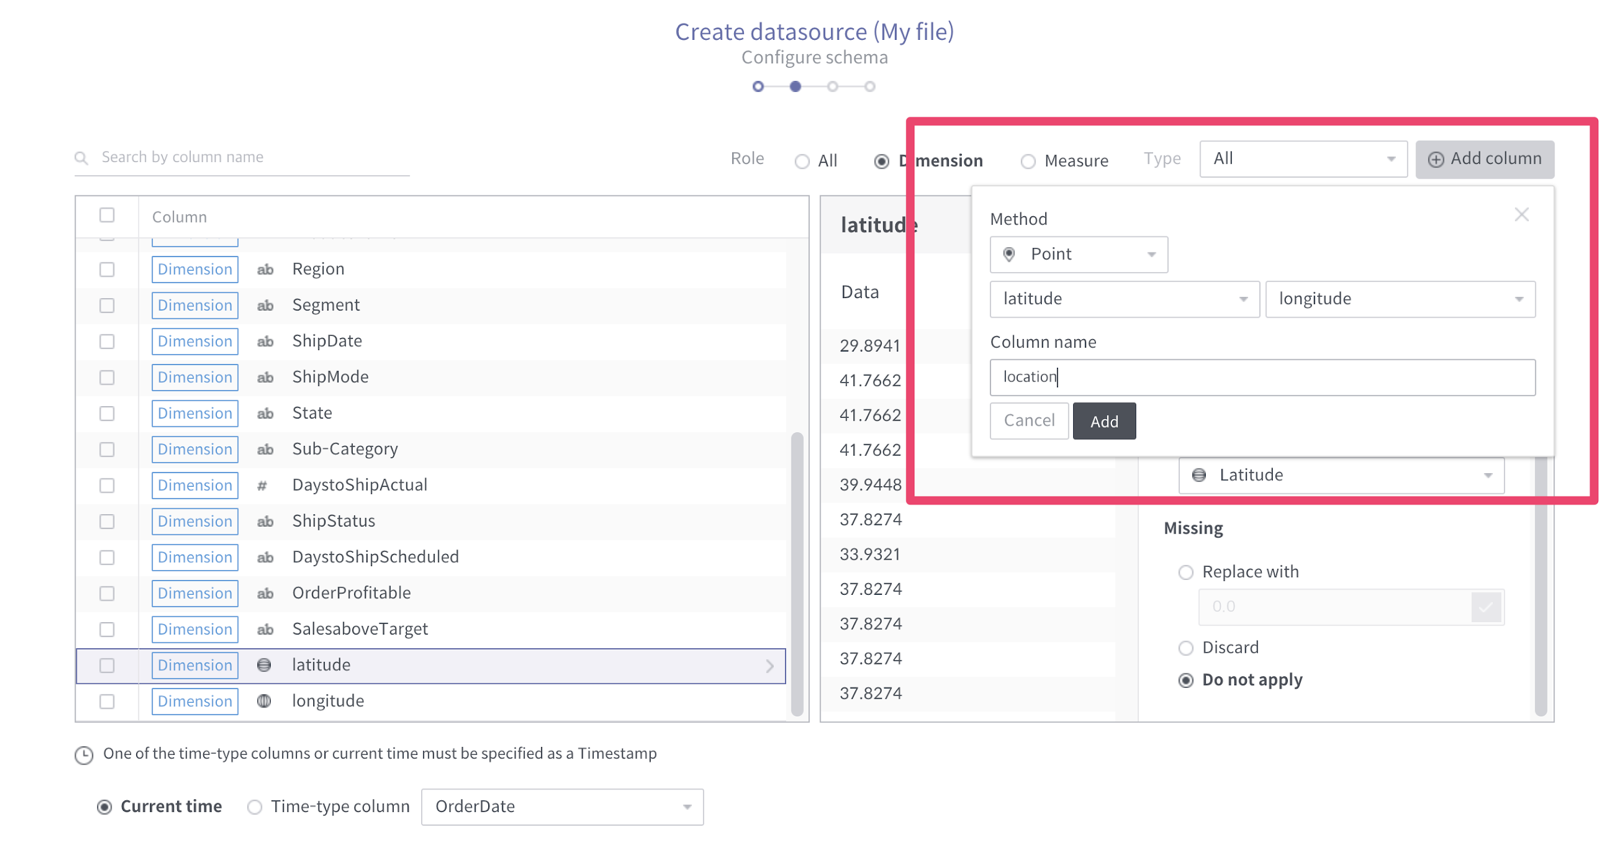
[Figure 3] Configure schema – Add column
Finally, set the Timestamp field to Current time and go to the next step. The final step defines the systematic properties of the Datasource to be created. Query Granularity is None and Segment Granularity is Month. Roll up must be set to false.
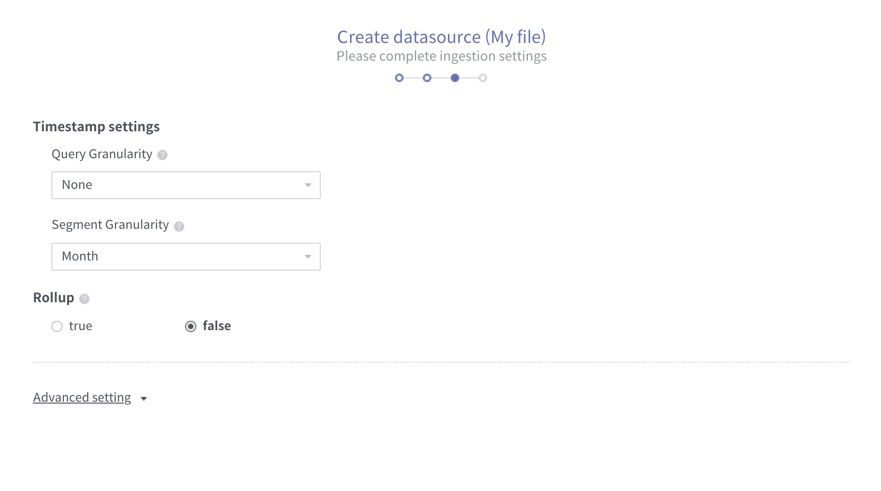
[Figure 4] Druid ingestion setting
Once the datasource has been created, it is time to display the data on the map using Datasource. Create a new workbook in your workspace, and create a dashboard within it. Select the slaesgeo you created earlier as the data source. A blank dashboard will be created and add a new chart here.
Select the map chart as a new chart type and select the location column and the sales column as shown below. Turn off the Use Cluster option. You can see Sales distribution by location on the map as shown below.
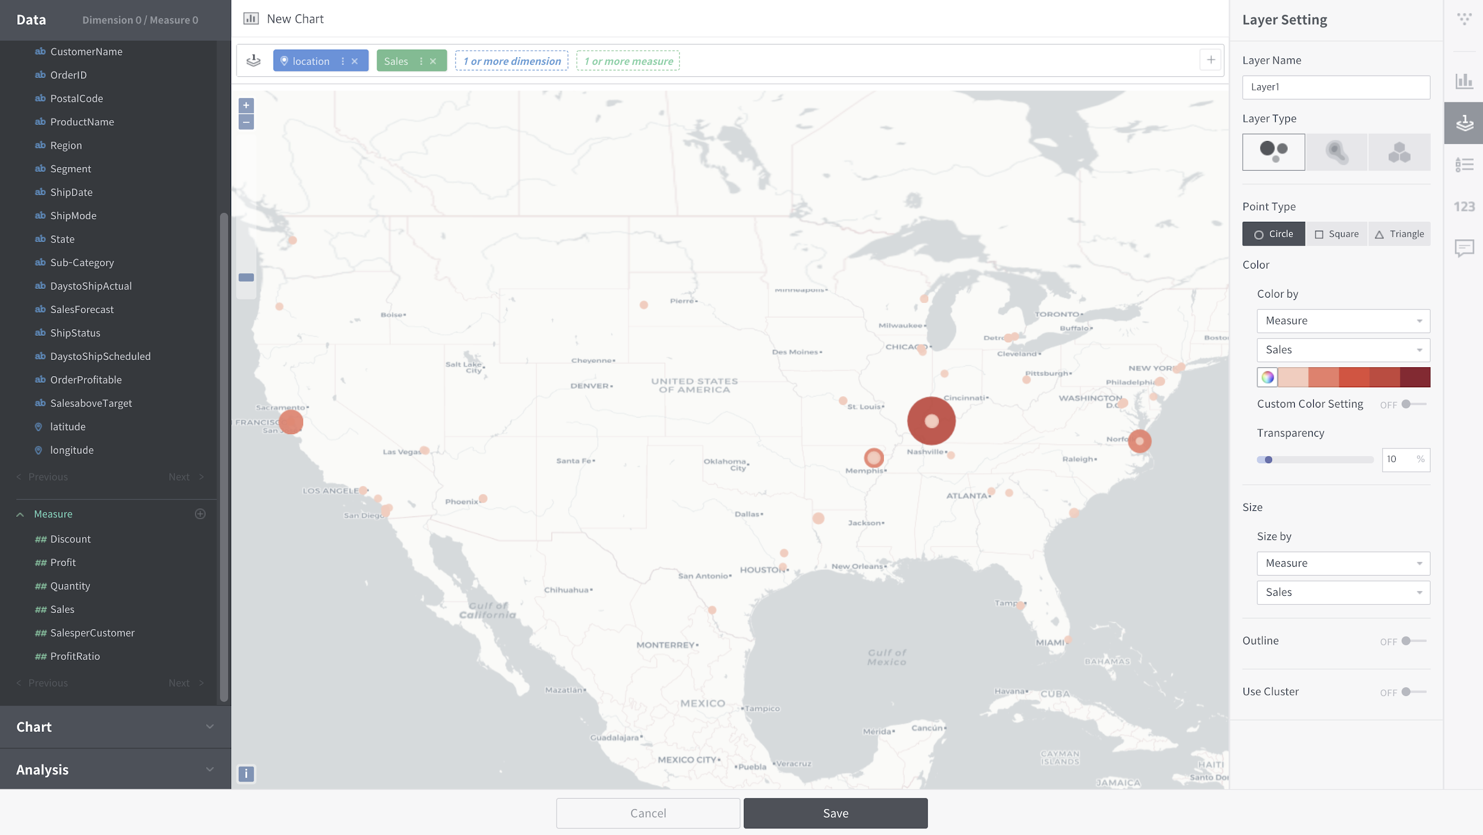
[Figure 5] Map Chart
If necessary, you can create a new layer to display other information.
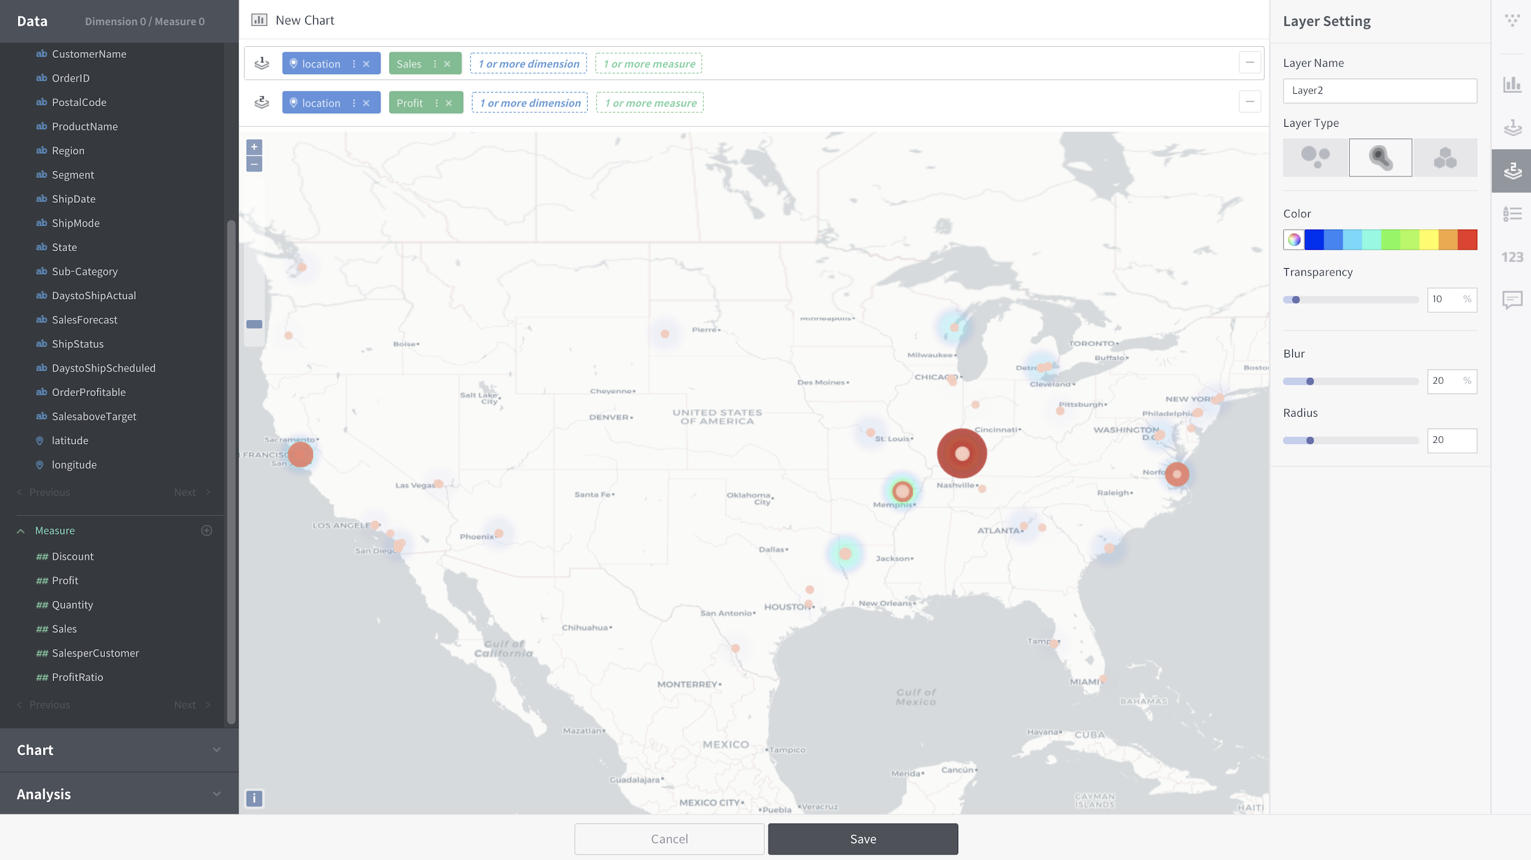
[Figure 6] Multi-Layered Map Chart
You can implement map charts by changing various options. Many Geo-related add-ons will be included in the 4.2.0 release which will be released soon.