Visualize Real-time Data with Metatron Discovery
Notice: Undefined offset: 1 in /data/httpd/www/html/wp-includes/media.php on line 70
Let’s find out how to create a real-time dashboard when having a streaming data.
First of all, you need a streaming data. I just create an artificial one for this test. If you already have one, just skip this step.
import sys
import json
import math
from datetime import datetime
from time import sleep
from kafka import KafkaProducer

#producer = KafkaProducer(bootstrap_servers='localhost:9092')

list_category = ['10', '20', '30'];
for i in range(0, 100000) :
        for cur_cate in list_category :
                cur_result = {};
		cur_result['category'] = cur_cate;
                cur_result['value_01'] = int(math.sin(i/float(cur_cate))*100)*1;
                cur_result['value_02'] = int(math.sin(i/float(cur_cate))*100)*2;
                cur_result['value_03'] = int(math.sin(i/float(cur_cate))*100)*3;
                cur_result['event_time'] = datetime.strftime(datetime.utcnow(), "%Y-%m-%dT%H:%M:%SZ");

                print(json.dumps(cur_result) );
		producer.send('realtime_sample', cur_result );
                sys.stdout.flush();
		producer.flush();
        sleep(1)
Above is the python code for generating 3 data records per every second.
Then connect this with the kafka with the code below.
./generate_sample_data.py | kafka-console-producer --broker-list localhost:9092 --topic realtime_sample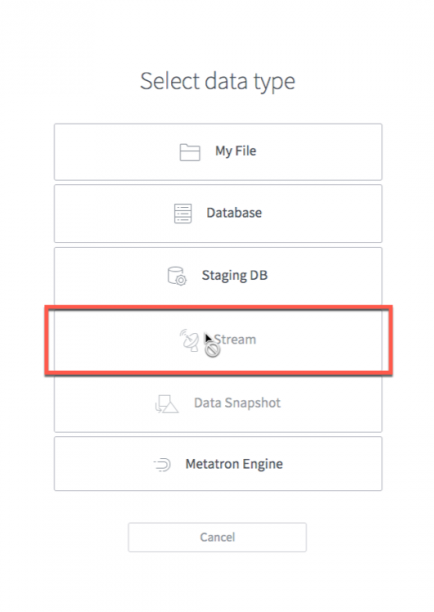
Next is a step for making Metatron datasource from kafka. We have a menu as a ‘Stream’. But not supported by interface yet. Don’t worry! We provide you RESTful APIs for advanced users like you. Let’s just use one of the APIs of Metatron.
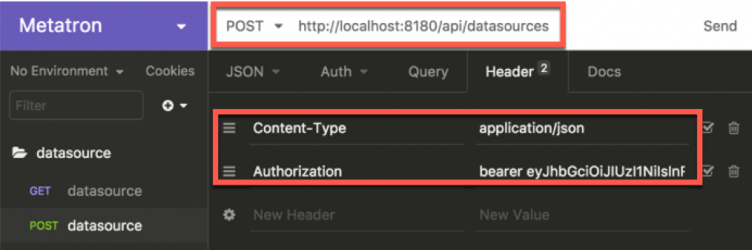
For this task, you can use any REST clients like insomnia.
You can create datasource by using ‘datasources API’ we provide with POST method. Notice that you need to fill ‘Authotization’ information out.
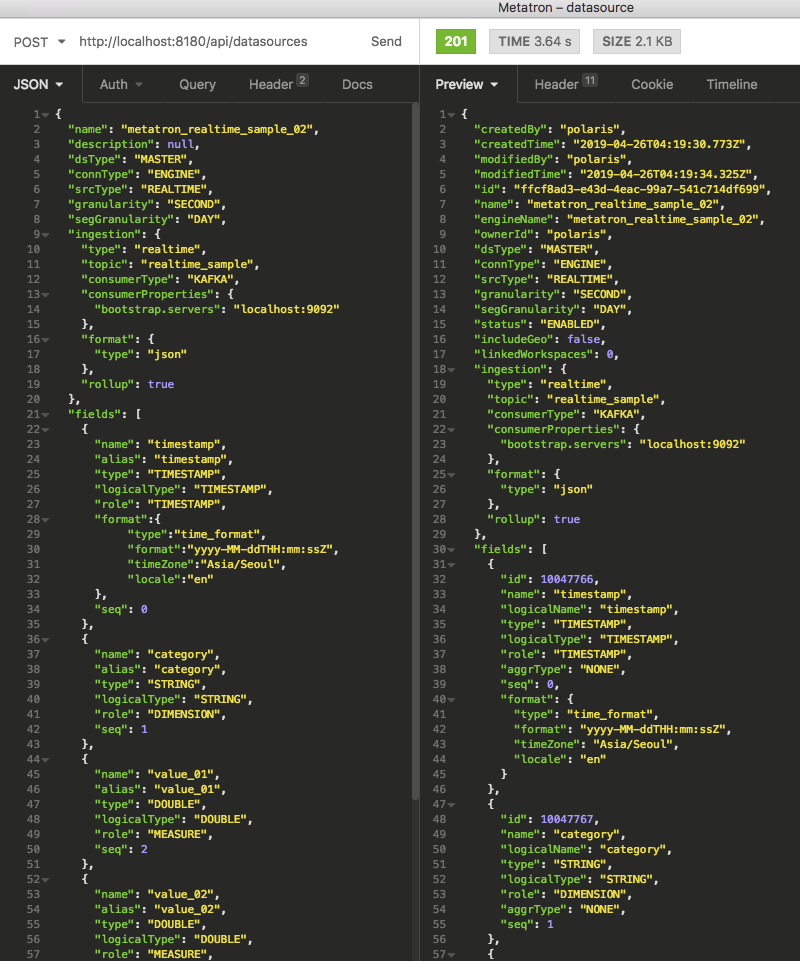
The input is a JSON format. The above screen is for reference of druid ingestion task for kafka. Ask us if you want to know the detailed input format.
To sum up, the datasource is created by requesting the API by writing the information necessary for datasource creation in JSON format.
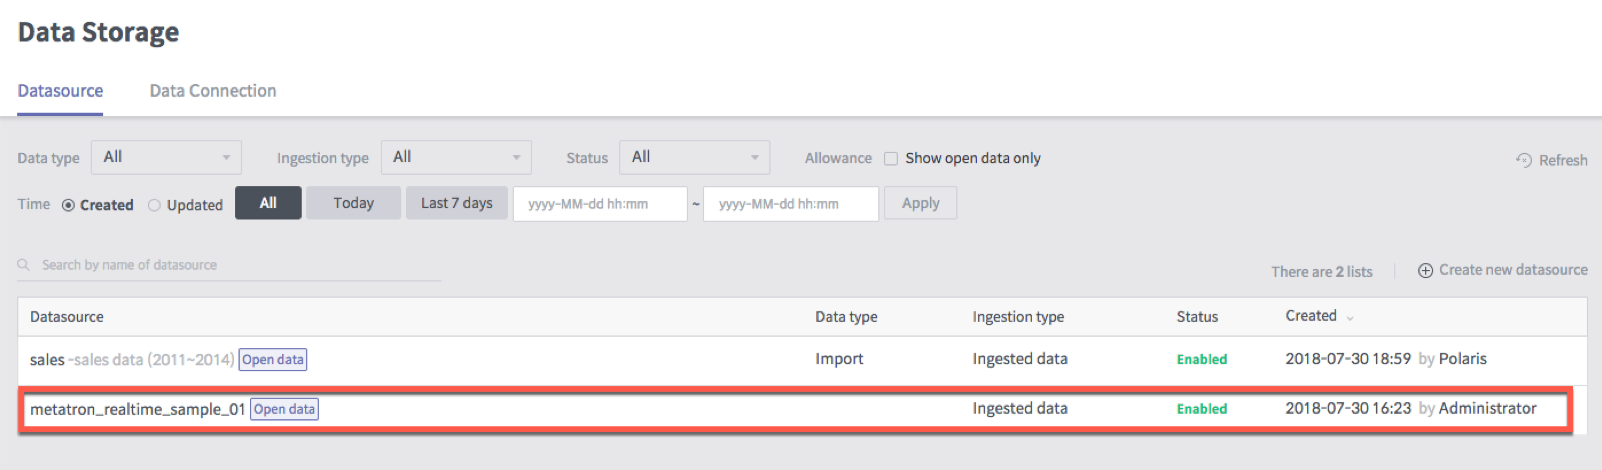

The generated datasource is displayed in ‘Datasource’ tab in Metatron Discovery client.
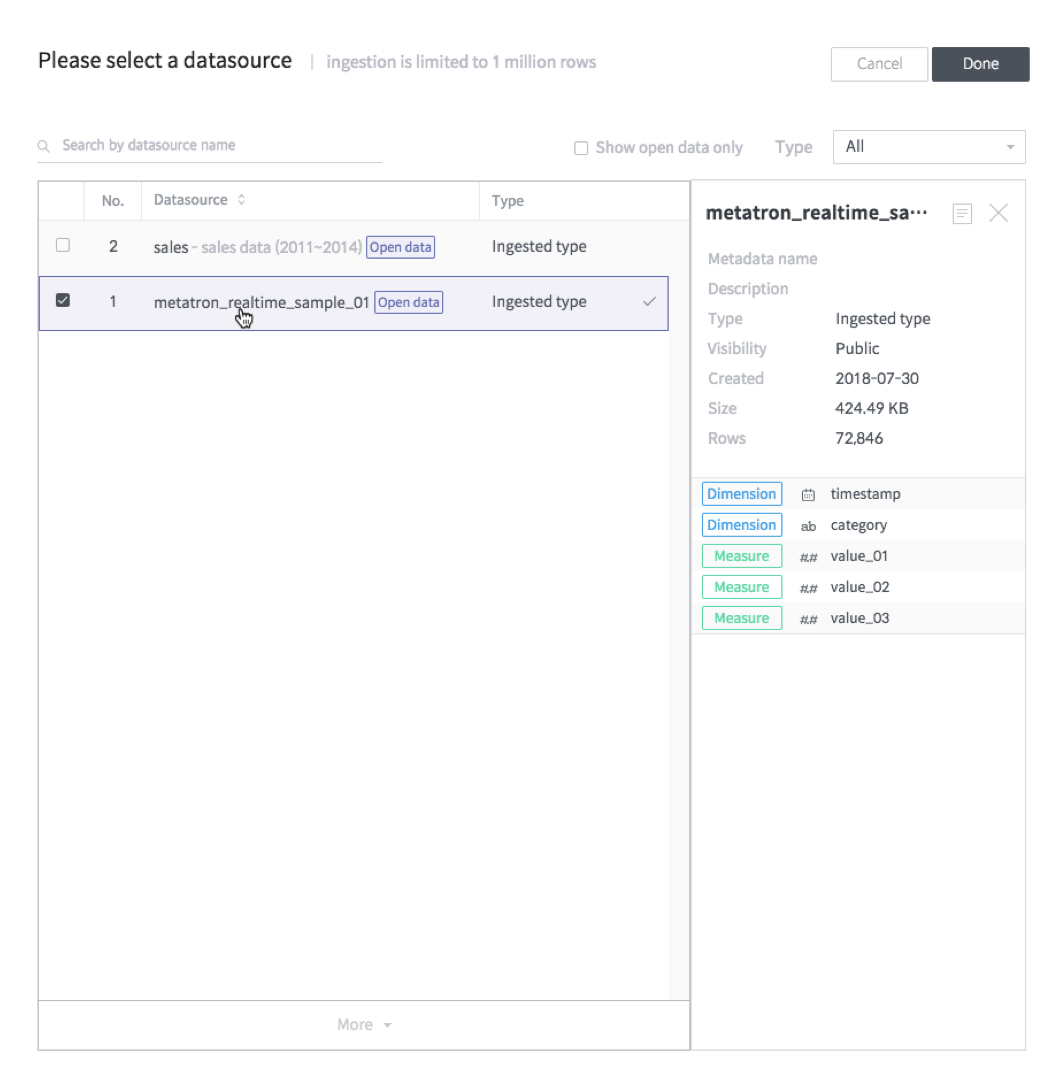
Once you have a datasource, it’s time to create a dashboard. First, select the datasource we ingested before for creating a dashboard in a workbook.
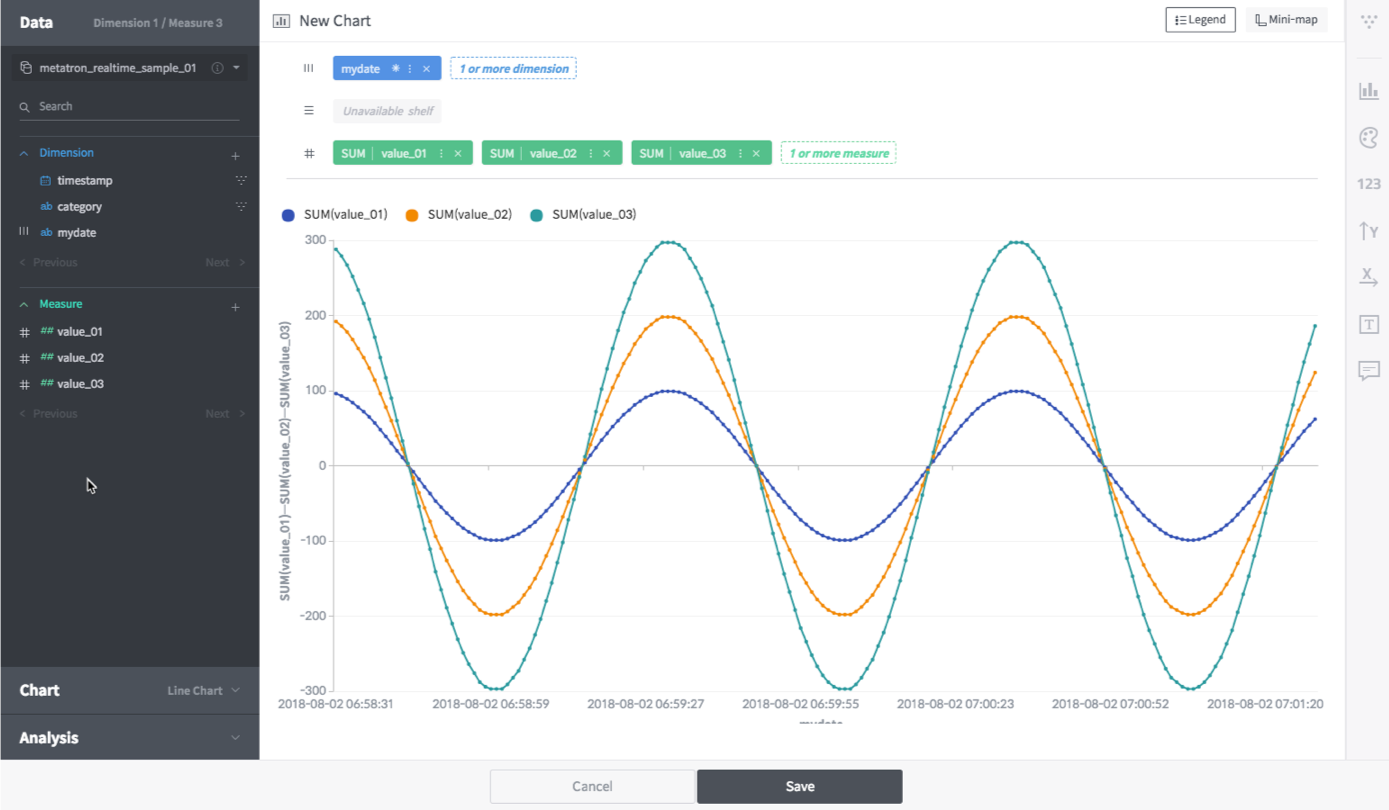
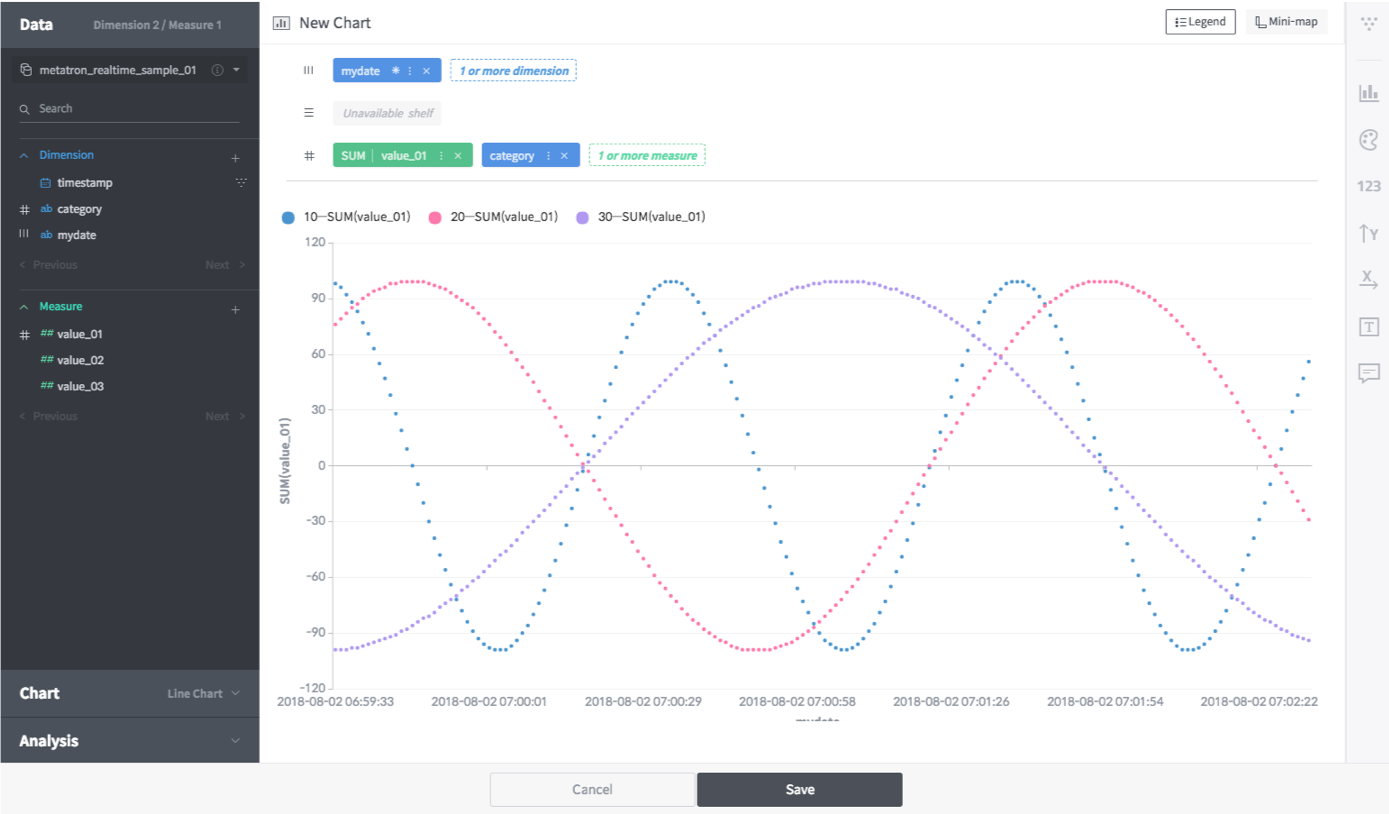
In my case, I created two different line charts with time(sec) on the X axis.
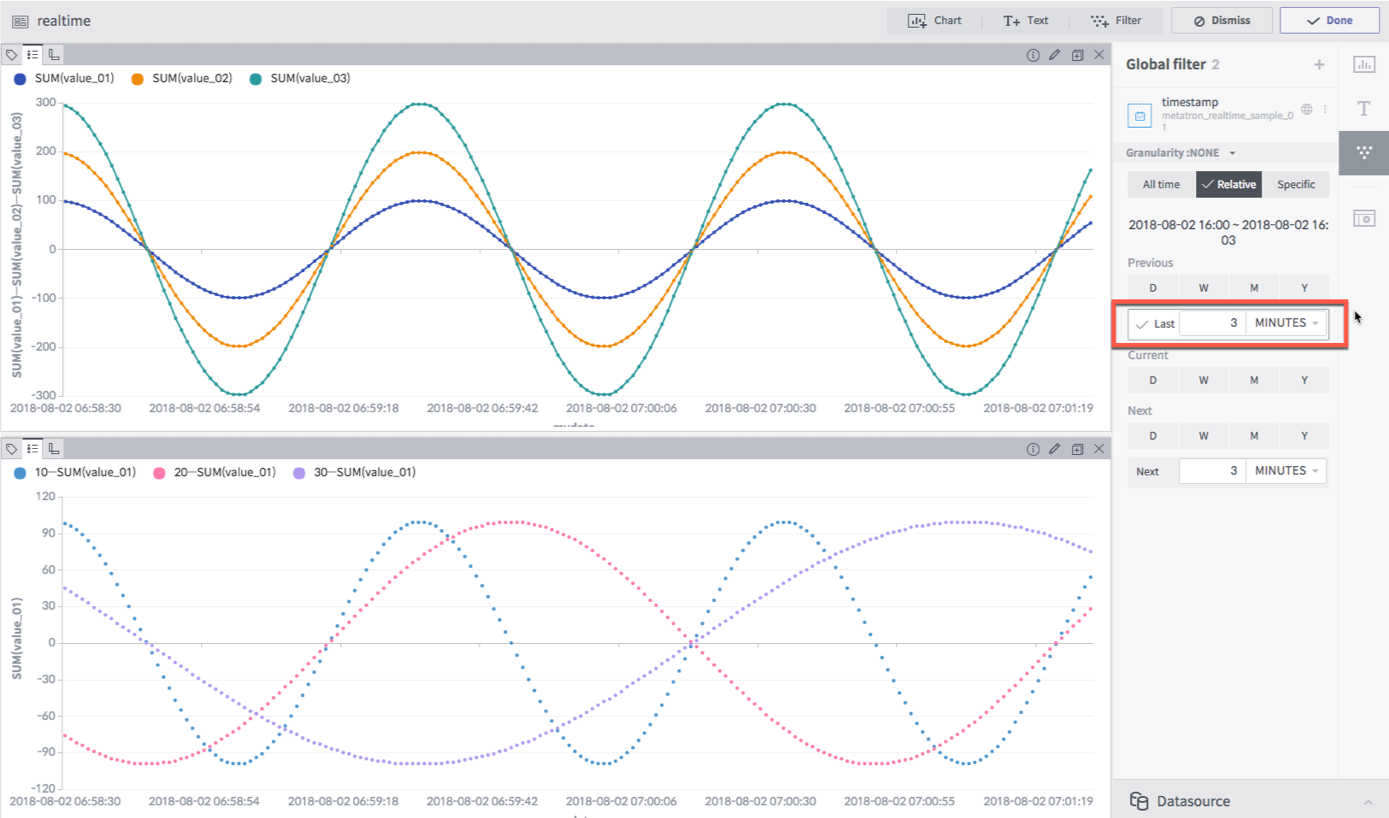
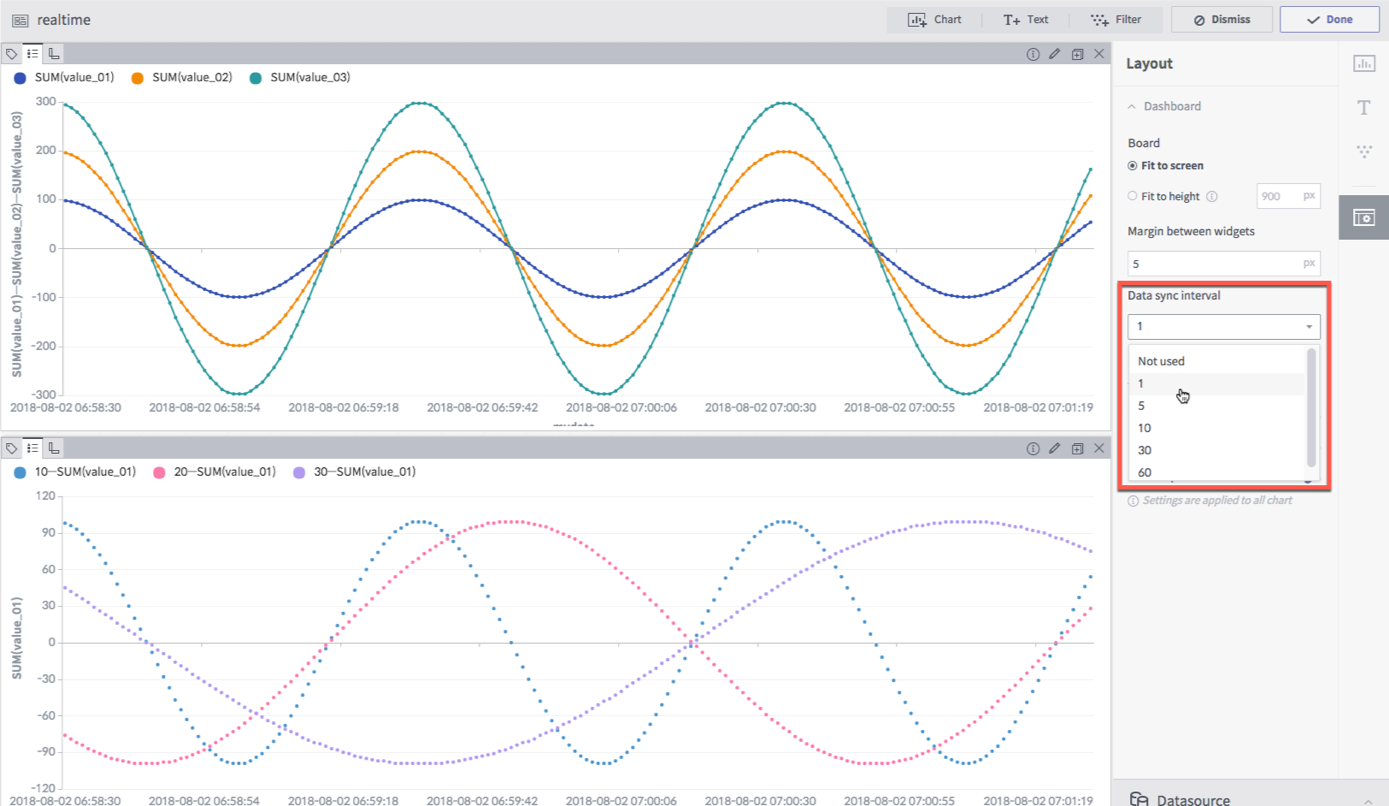
Let’s limit the data drawn on the chart to the last three minutes using a global filter on the dashboard edit page. And the data synchronization period is set to 1 second.
It’s done! Now you can see real-time data from the dashboard for the last three minutes, updated every second.