Building a Simple Map View – Geospatial Data with Metatron Discovery 2
Notice: Undefined offset: 1 in /data/httpd/www/html/wp-includes/media.php on line 764
Notice: Undefined offset: 1 in /data/httpd/www/html/wp-includes/media.php on line 766
Notice: Undefined offset: 1 in /data/httpd/www/html/wp-includes/media.php on line 769
Notice: Undefined offset: 1 in /data/httpd/www/html/wp-includes/media.php on line 70
We’ve introduced how to load point type geometry data source and creating multilayers in our previous blog article:
This time we’ll discuss further – about applying polygon data, one of the geo types, and building a more concrete geospatial analysis with it.
0. Use case
I like the city San Francisco. If I were to live there or travel, safety would be an important factor to consider. We will first search up data that indicates safety factors, and by analyzing the data with geo analysis we will find out what insights we can get from it.
1. Find data!
So first, I should prepare the data for my safety. For the data, I downloaded the public data from DataSF.
Police department incident reports are close to the data that I am looking for. And I also have information about the zip code area for geospatial analysis.
- Police department incident reports :
https://data.sfgov.org/api/views/wg3w-h783/rows.csv?accessType=DOWNLOAD
- San Francisco ZIP Codes :
https://data.sfgov.org/api/views/srq6-hmpi/rows.csv?accessType=DOWNLOAD
We are going to use these two data and load them on Metatron Discovery.
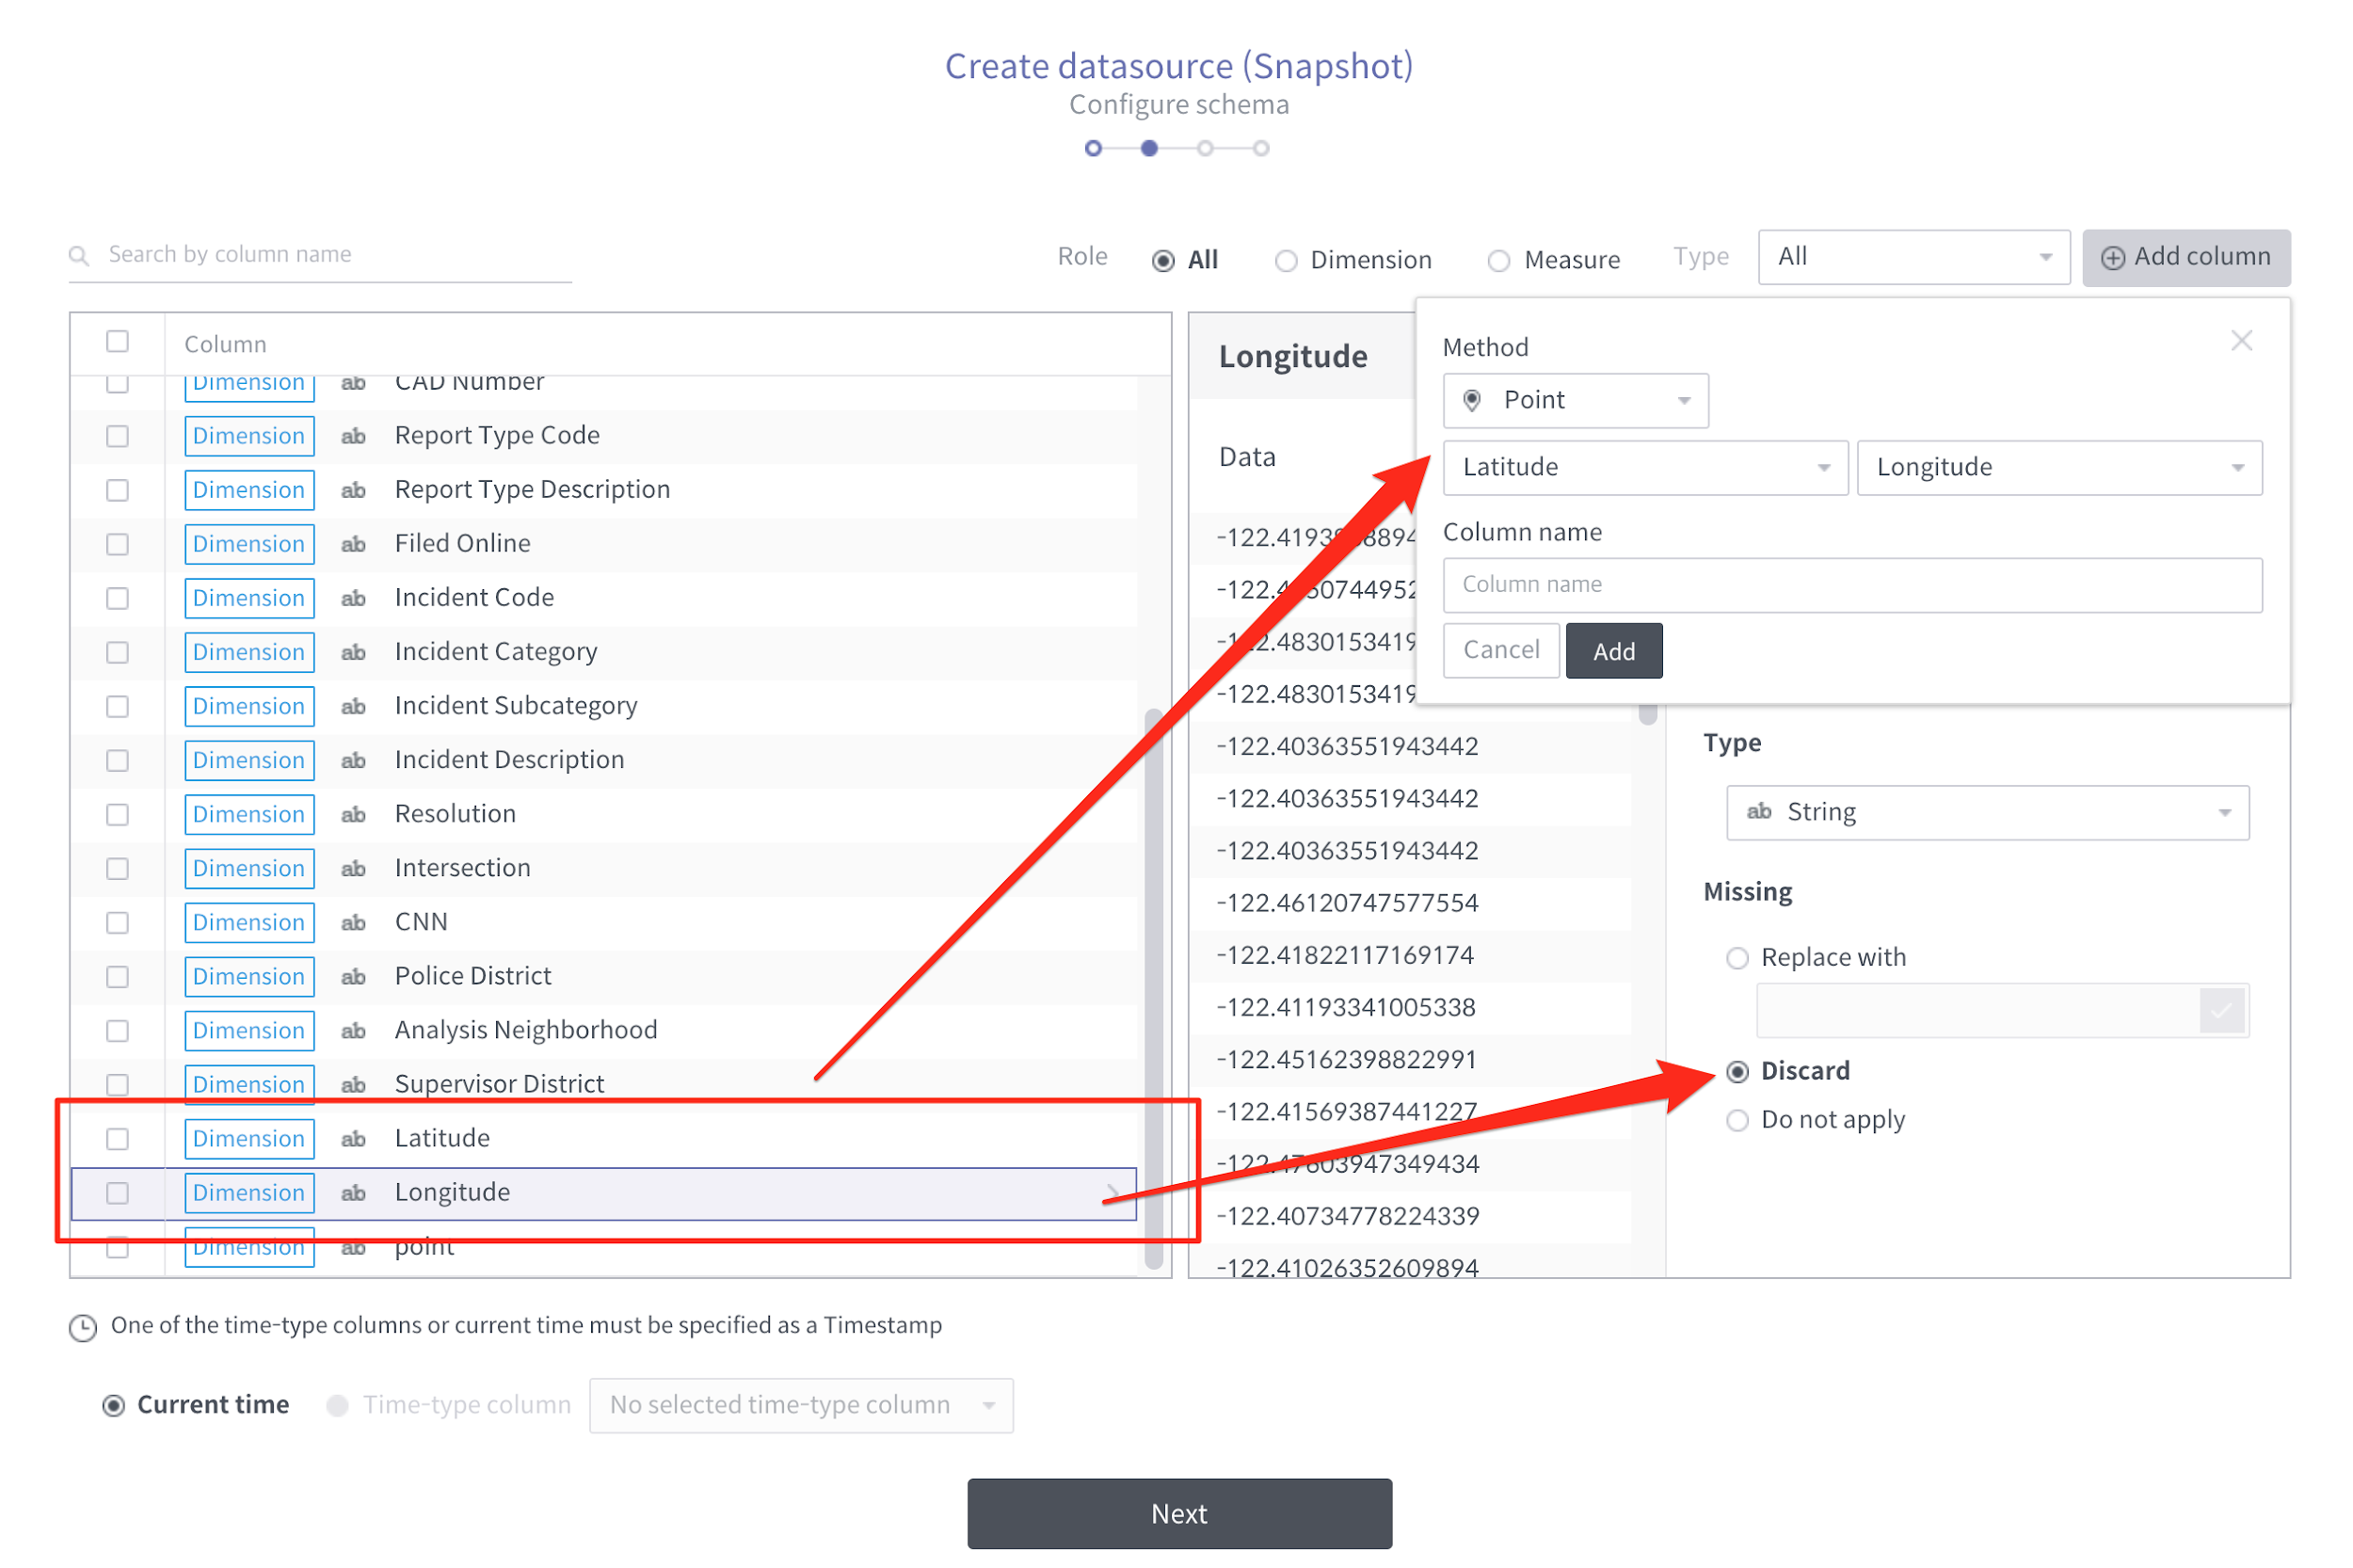
In the Police department incident reports, Latitude/Longitude exists as separate columns. So we need to combine the two columns into a point type column. (The analysis will be based on spatial information, so for the Latitude/Longitude columns that have no data there should be a “Discard” option to prevent it from loading.)
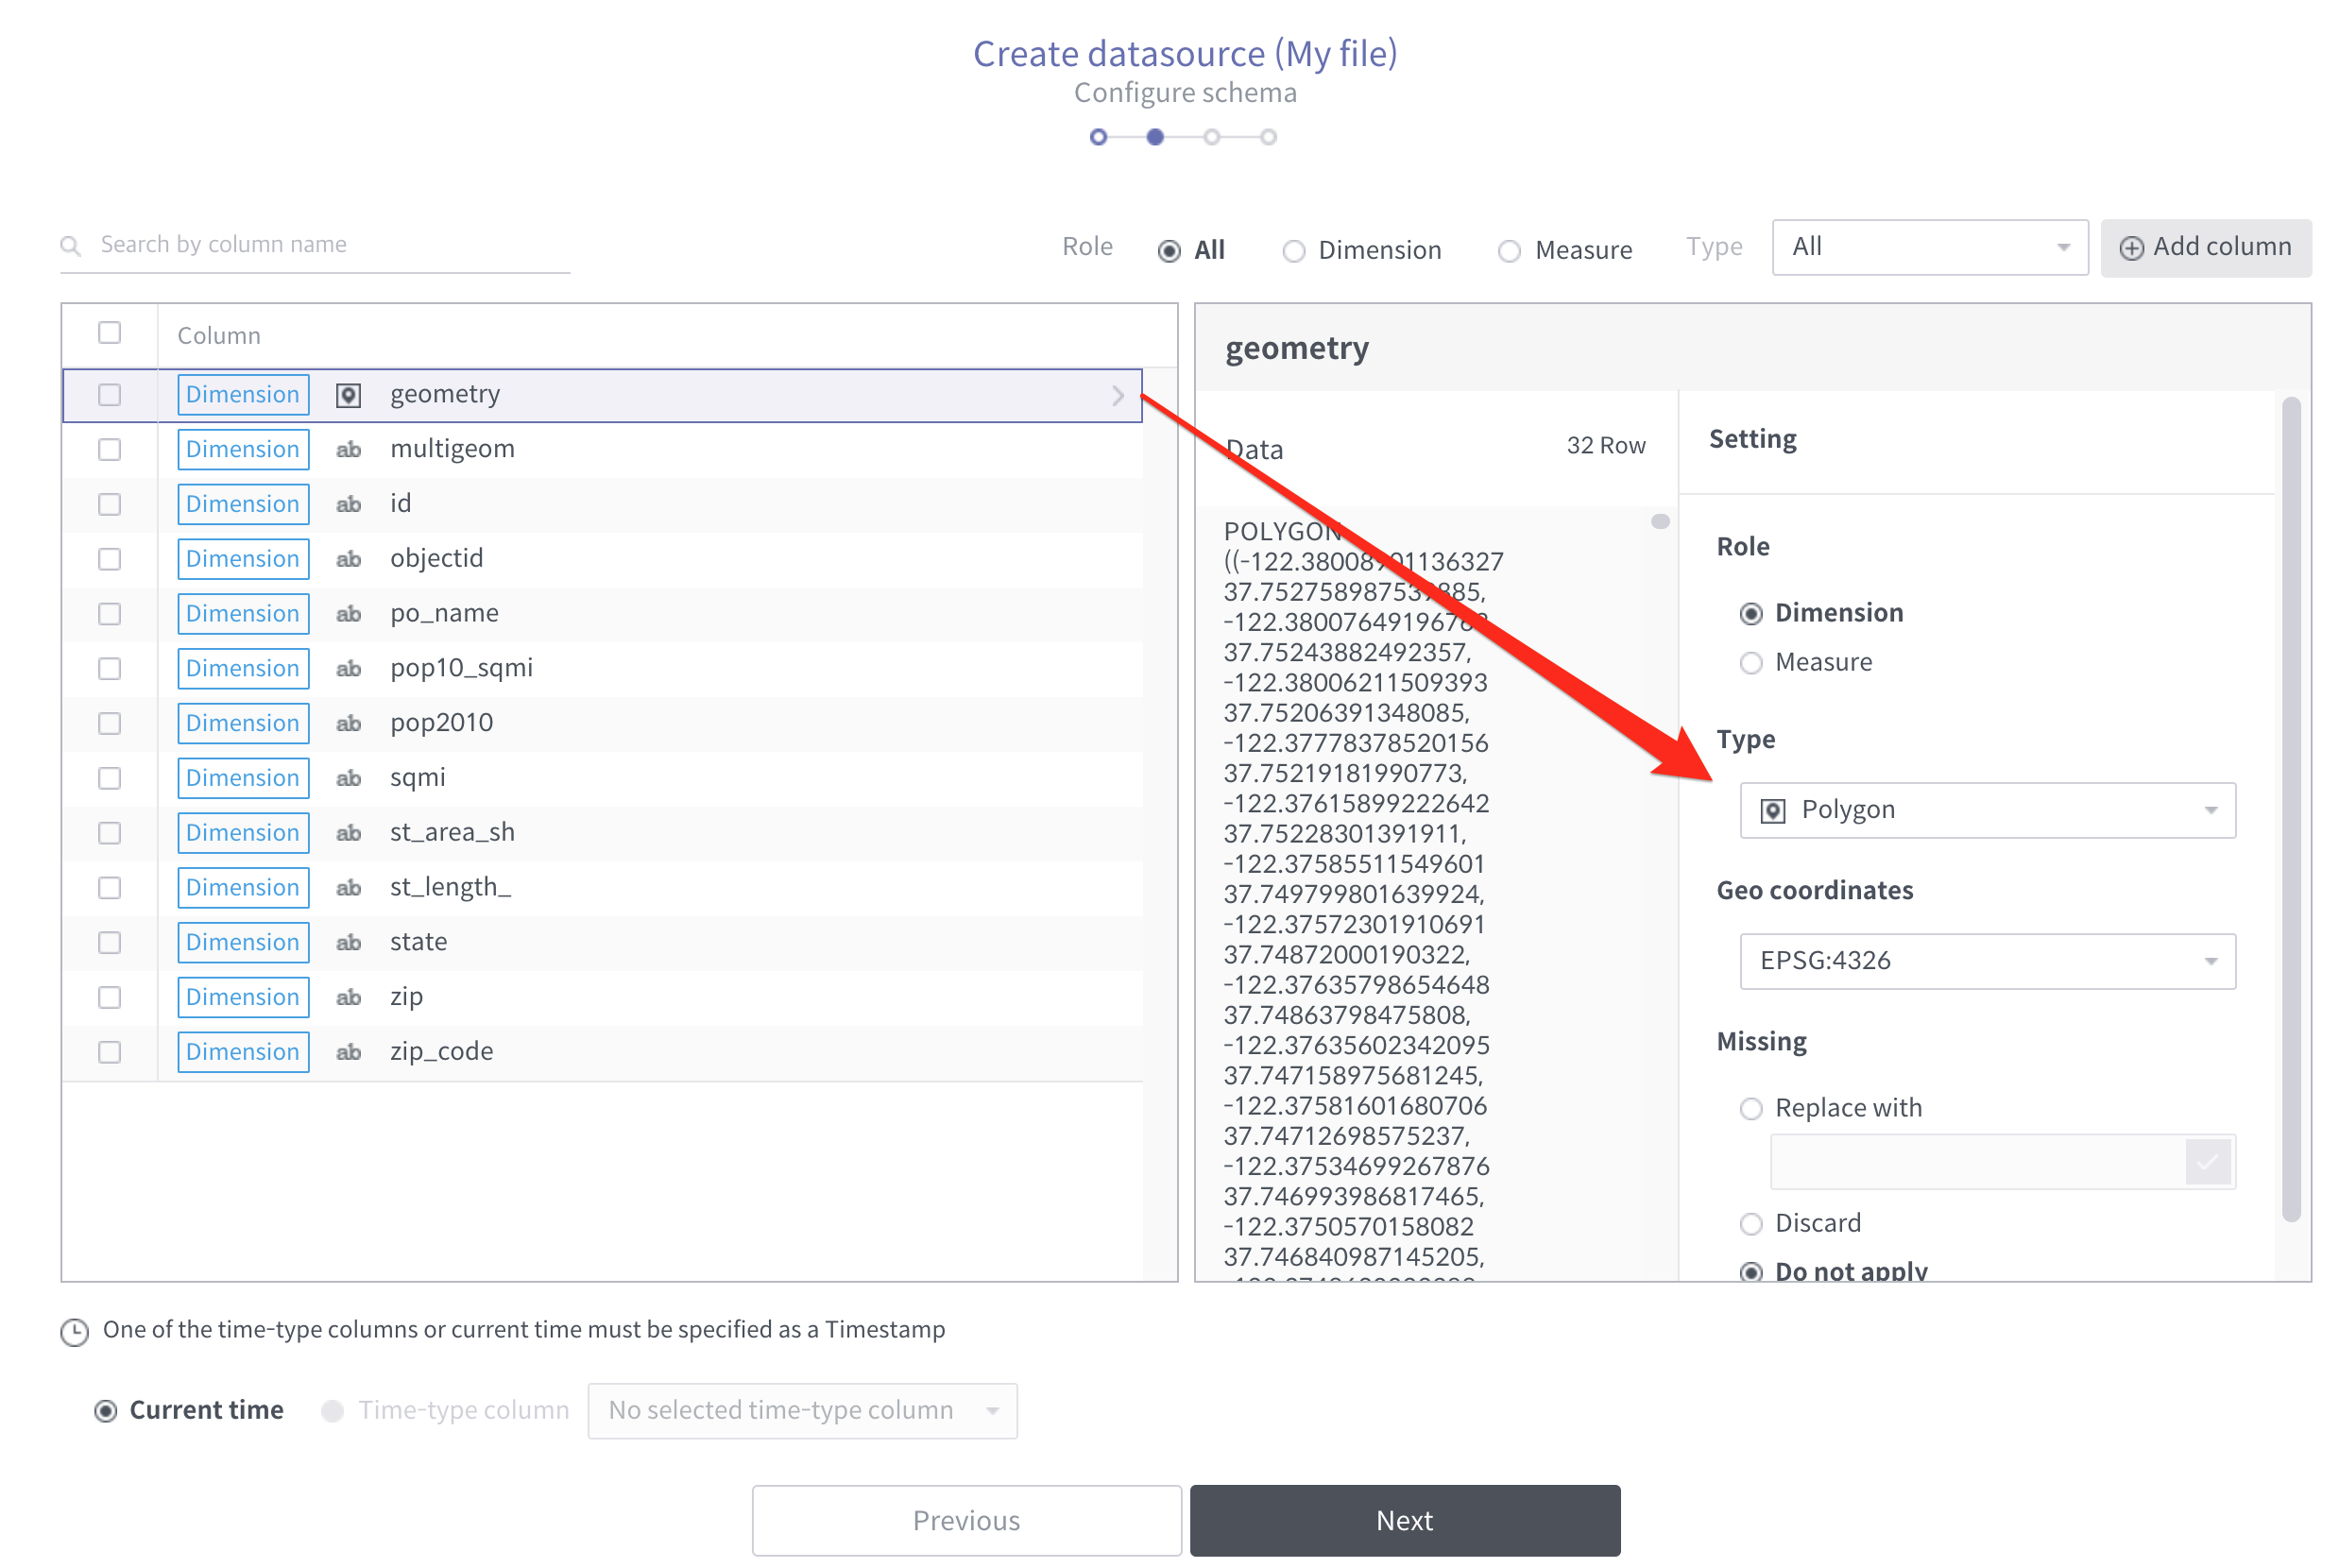
And, as the zip codes are provided in a WKT format of polygon type, we need to set the type as Polygon.
2. Build a map view!
Before we start the analysis, let’s create a dashboard in the workbook.
Map analysis is processed based on two layers which are to be presented on a basemap.
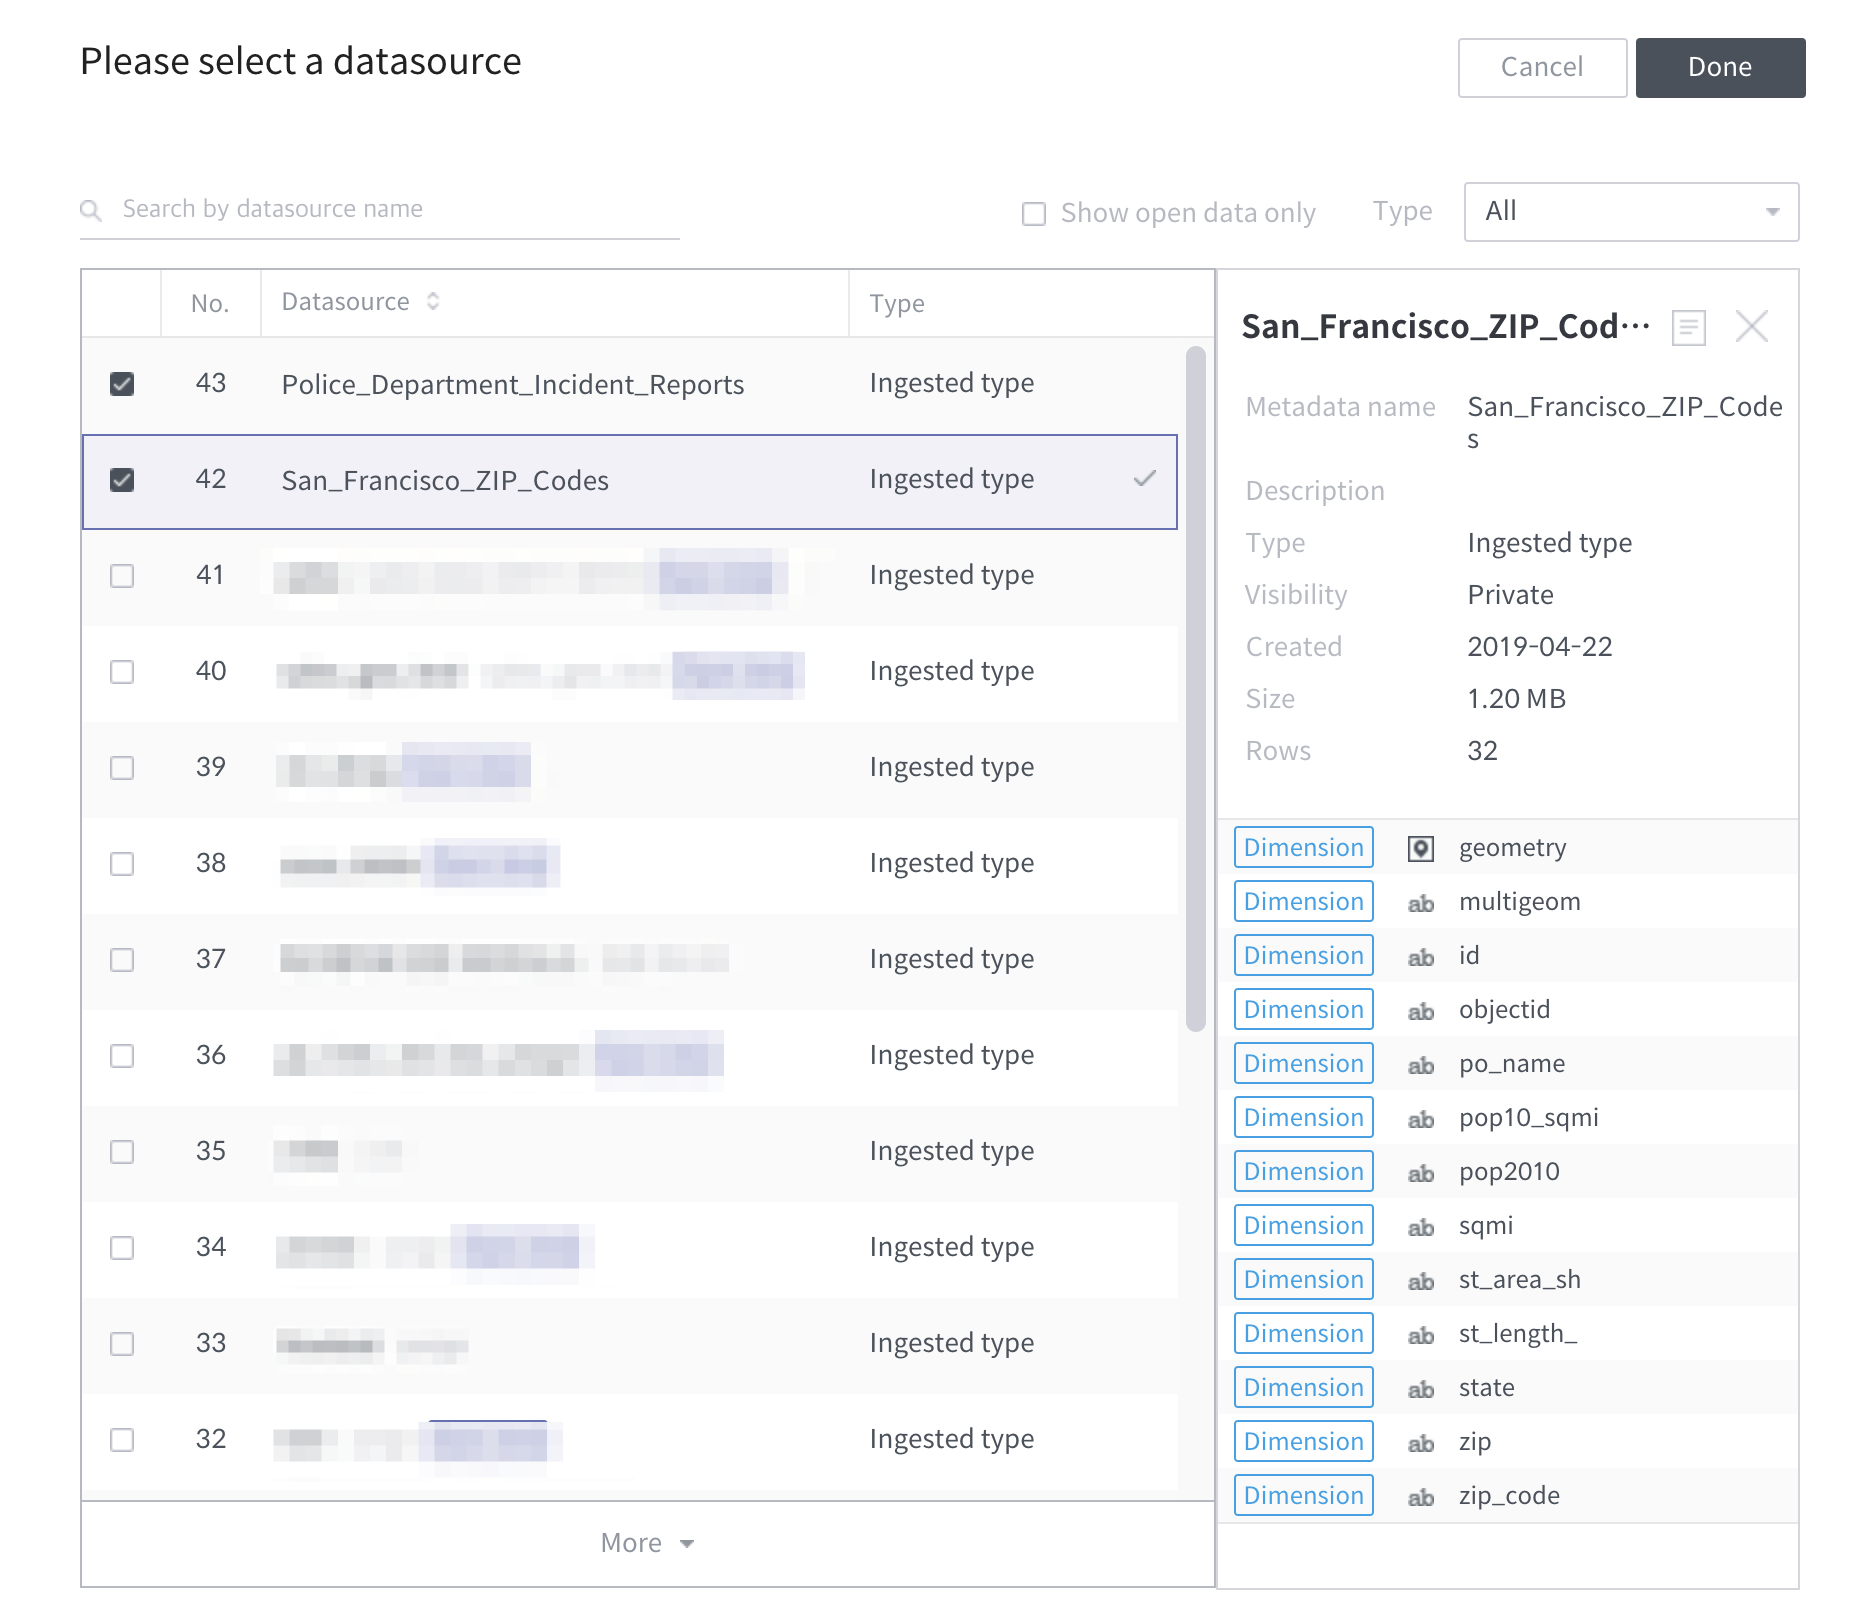
Unlike other chart views, each layer is represented with a single data source only. Therefore, we need to select two data source when creating a geo dashboard.
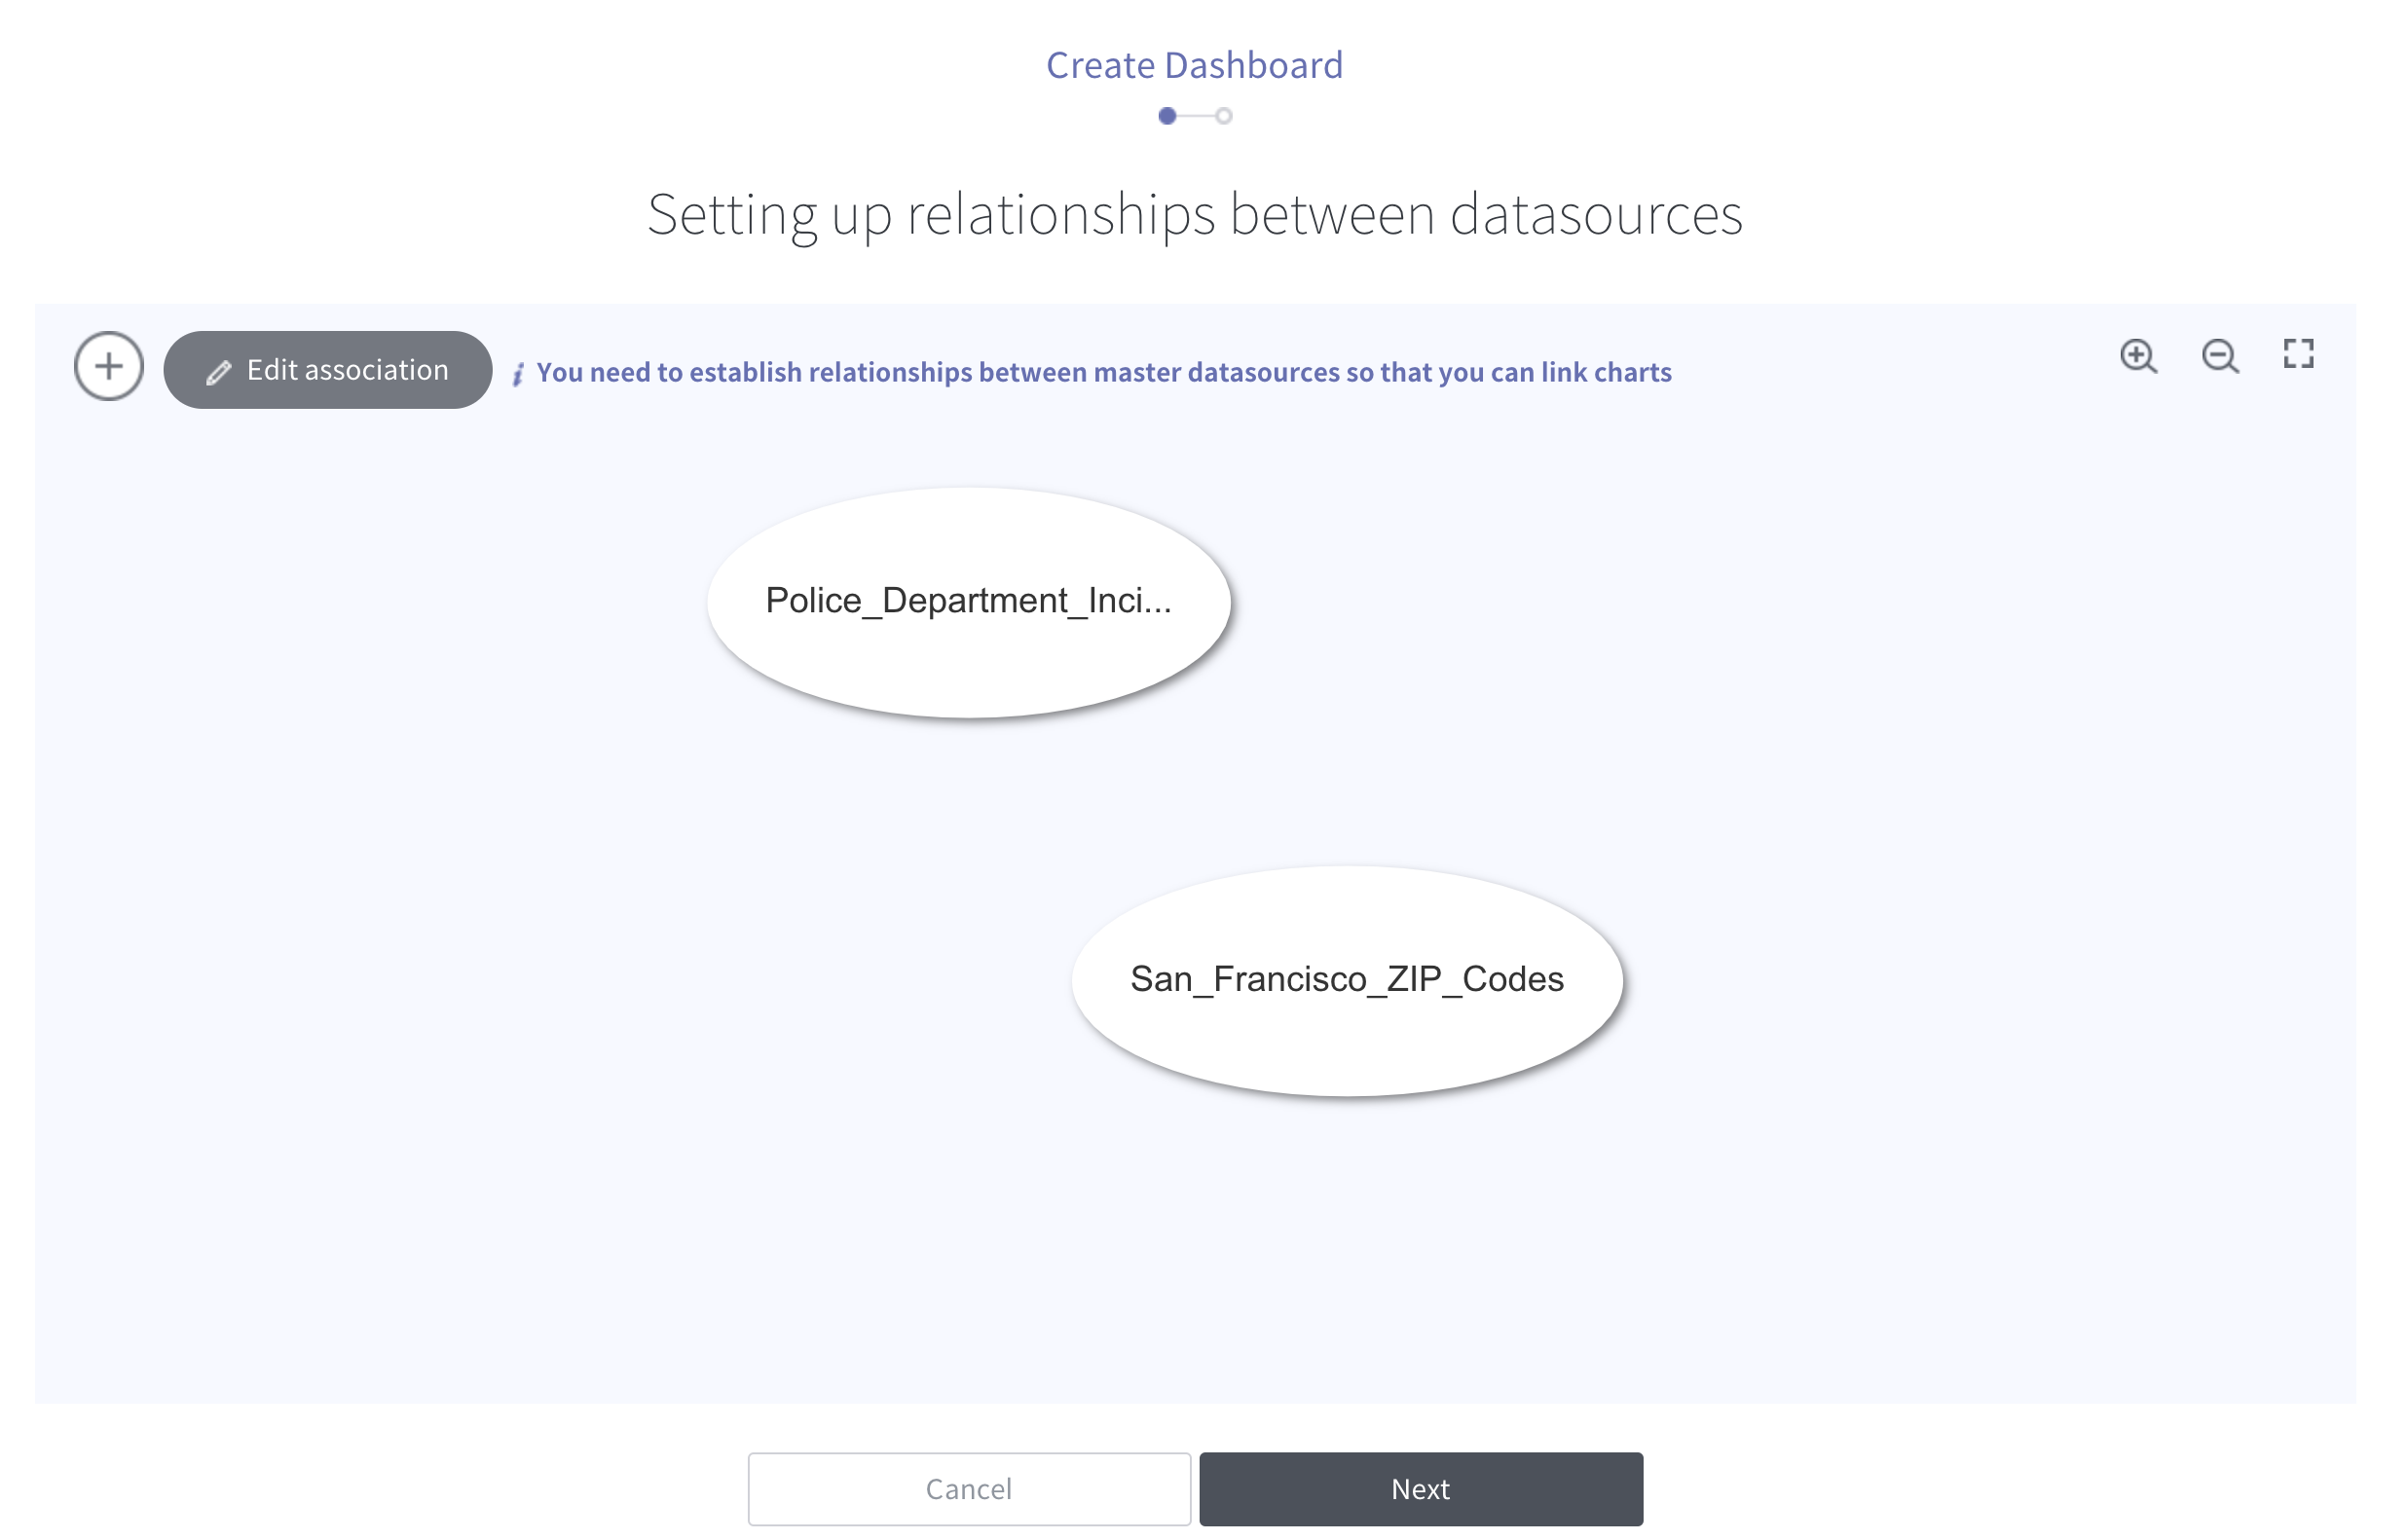
With the dashboard set up like this, let’s go on to the map view.
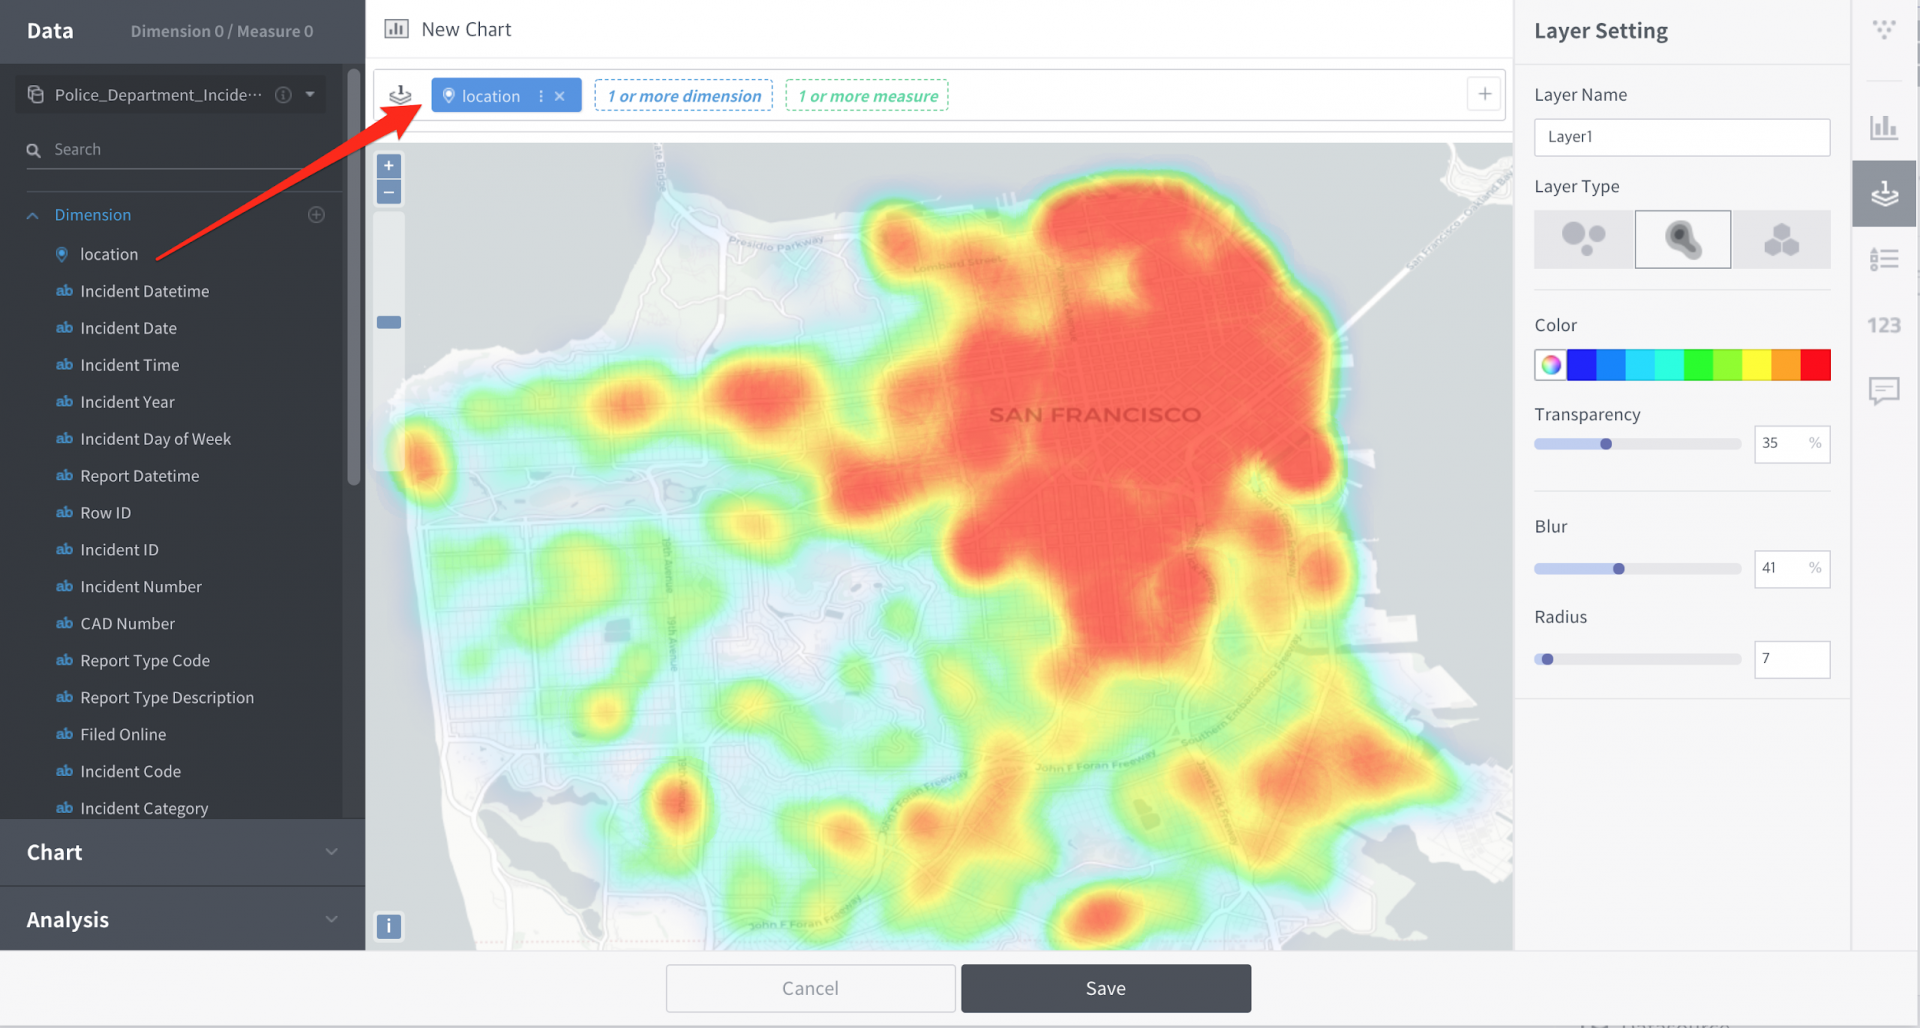
First, we’ll build a layer with the police incident report.
Drag and drop the geometry column into the layer.
Additional information data, to set the size and color of the geometry column, can be put on the layer’s dimension or measure field.
The initial view is built as clustering. Here we use the heatmap to see the distribution of incidents over regions. Now we can see a brief overview of which regions have the most incident records as below:
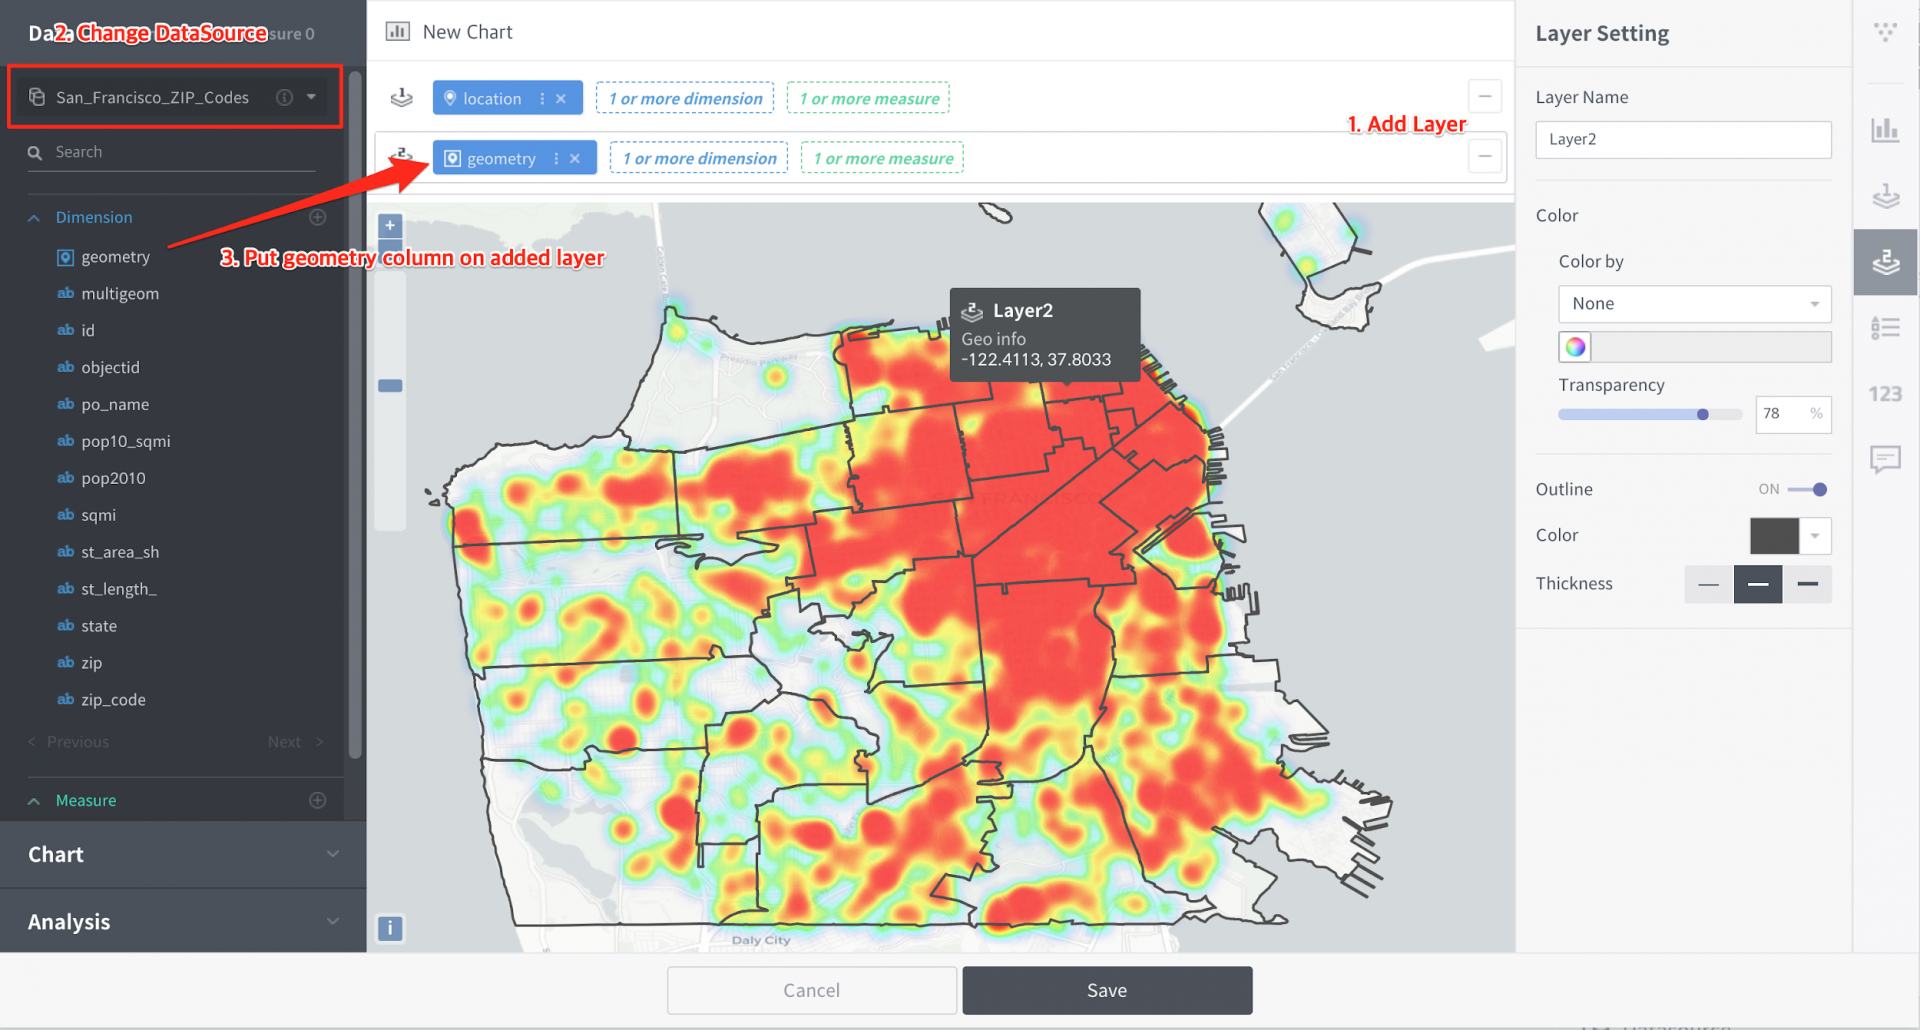
For a more detailed regional view, let’s add on another layer.
Add a layer by clicking on the “+” button on the right end of the first layer. Then at the very top of the data panel, change the datasource to zip-codes datasource.
Then put the polygon geometry column on the second layer.
You can see the regions marked based on the zip code area as below and with it you can check the precise region with the most incidents.
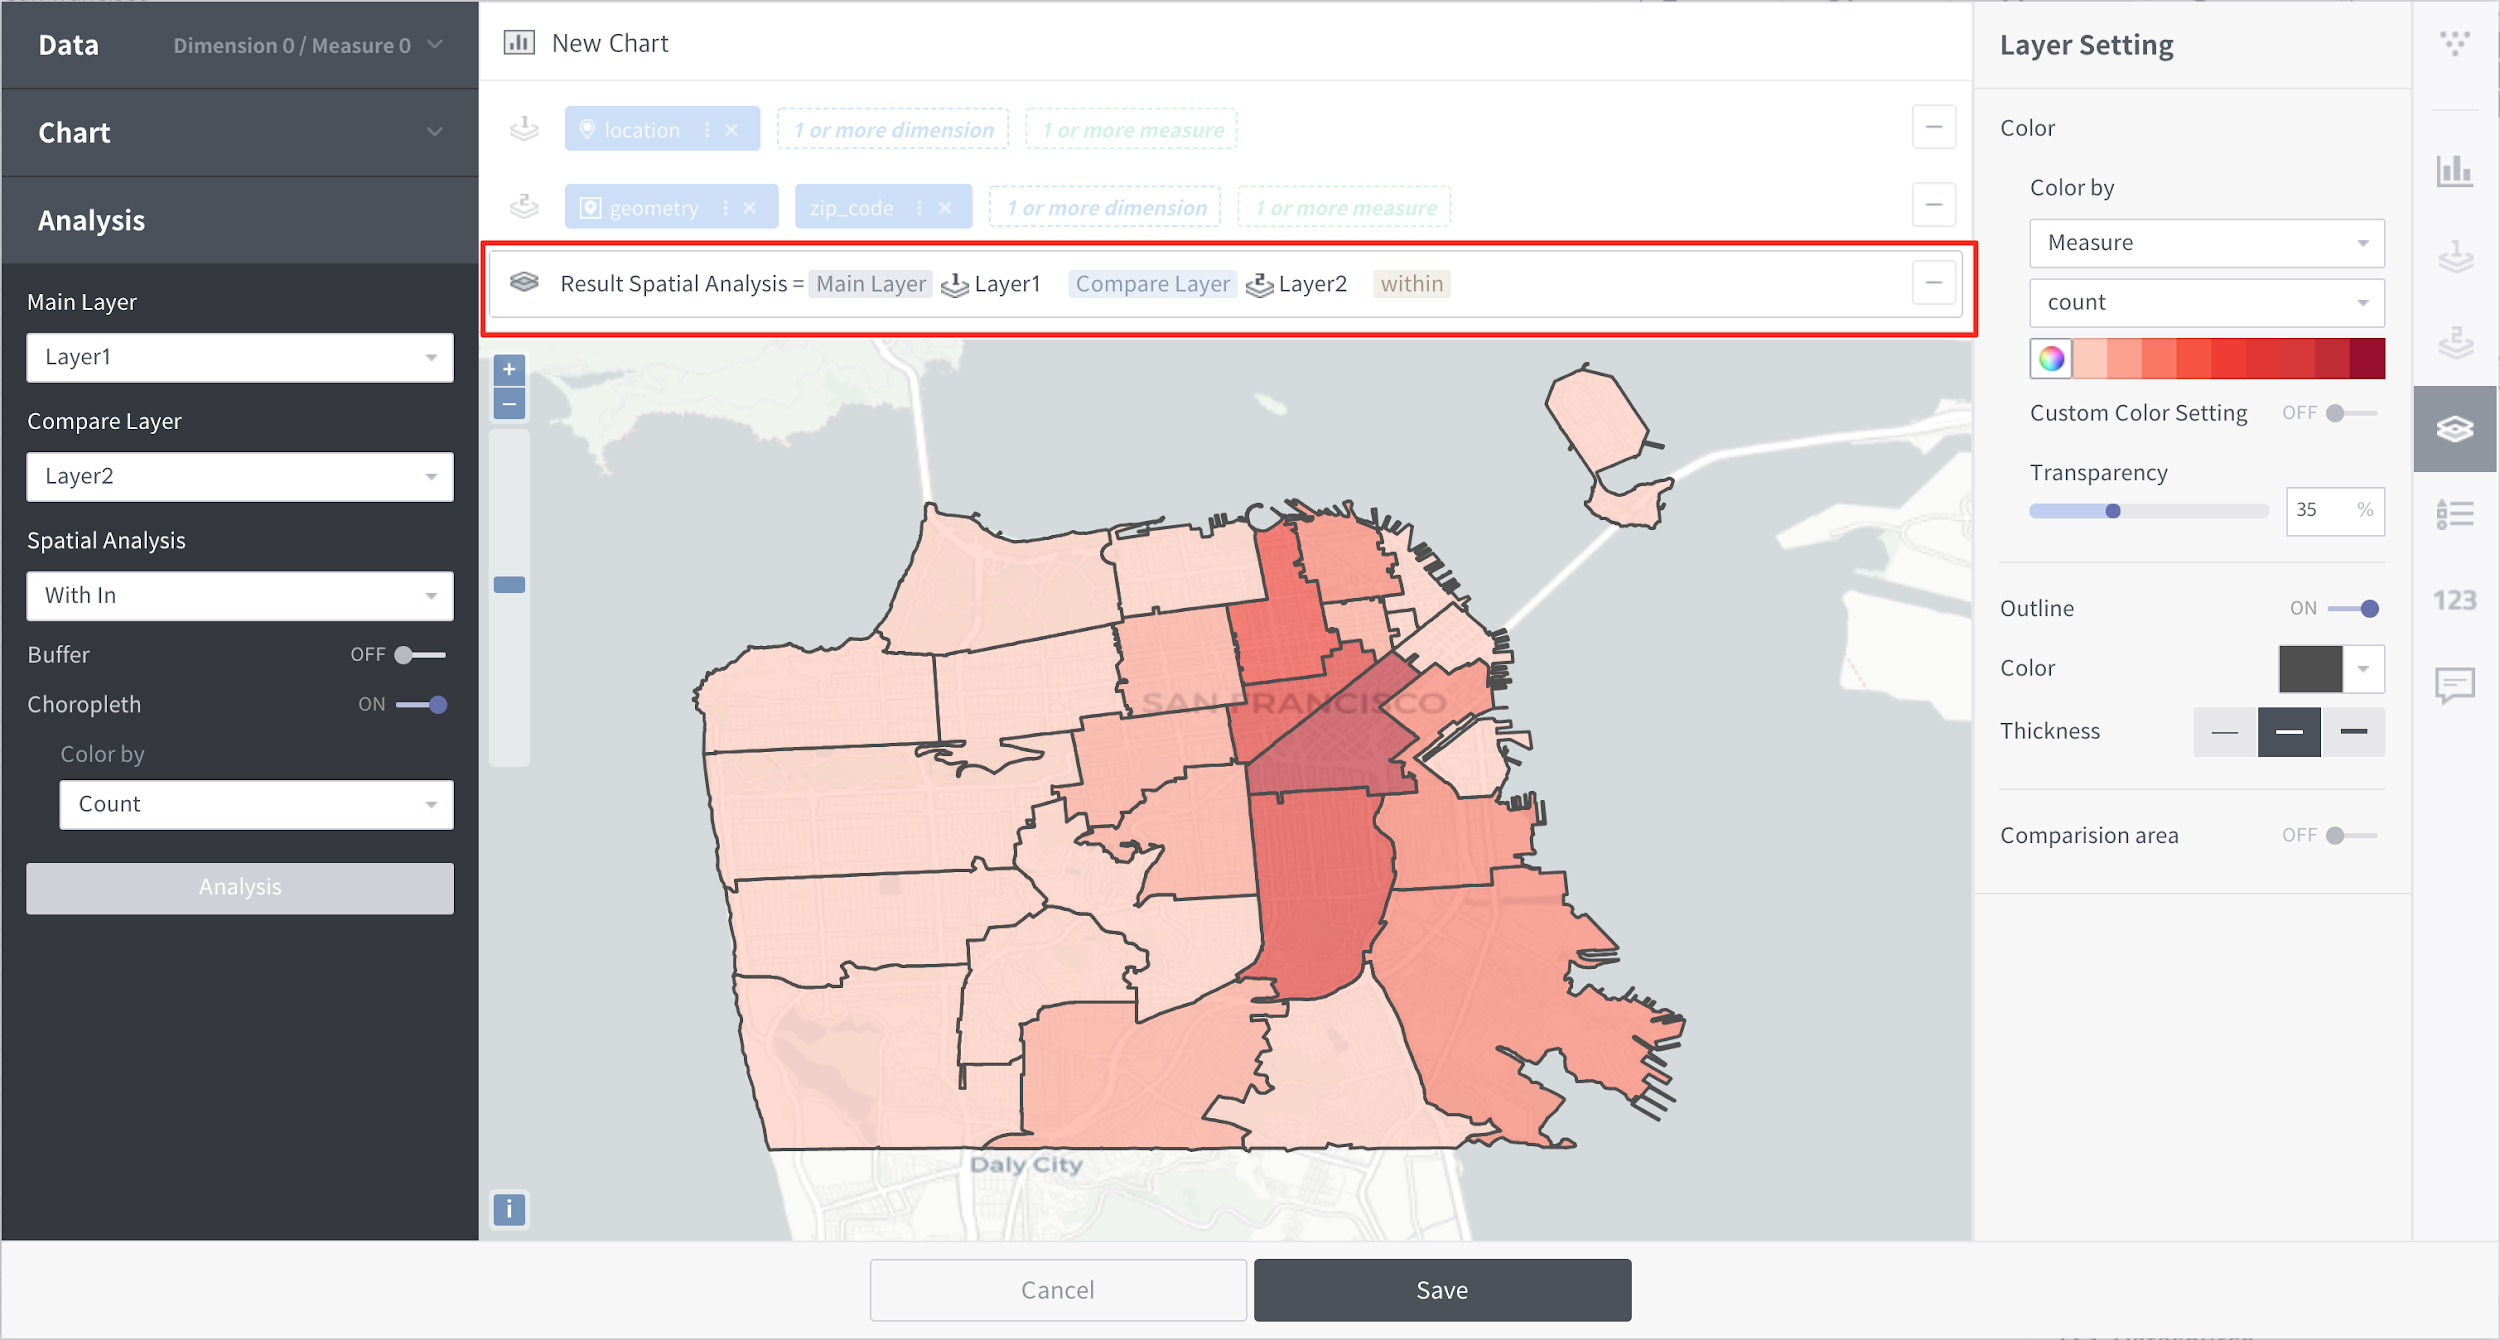
3. Geo Analysis!
To find out more precise distribution of incidents by zip code area, we can use geo analysis.
First we define the role of the layers when performing analysis.
The layer subjected to relation/operation is set as the main layer, and the layer that determines the boundary is set as the compare layer.
There are two options for the operation method, based on the compare layer. Geometry of the main layer can be included as a whole, or intersected.
There is an option for boundary settings as well. Buffer is used when enlarging the boundaries of the geometry columns in the compare layer. Usually, this option is used when point/line exists in the compare layer and you are finding the radius boundary of the geometry.
Also, with the choropleth mode you can perform operation on the main layer’s operation method geometry, based on the compare layer boundary.
Here we want to show the number of incidents in each zip code areas, so like the screen below we only used within method and choropleth mode then checked the result of the operation. As you see, you can get a more detailed view on which area has more incidents. As we expected, since downtown area has high floating population, more incidents were reported in the area.
We’ve learned about a simple map analysis today. By following the steps guided in this article, you can perform operations such as presenting various relationships with point/line/polygon type geometry and see it on your dashboard.
We are currently working on more operation methods and dashboard interactions. As we add on, we will continue introducing various use cases with the features. Please be updated with our news here on our blog!
One Response
Can you give me a source to get geometry data for anycountry (or just for Vietnam) to import Geometry Polygon data into Metatron.
I cant find the way to get a polygon data to import it into metatron.